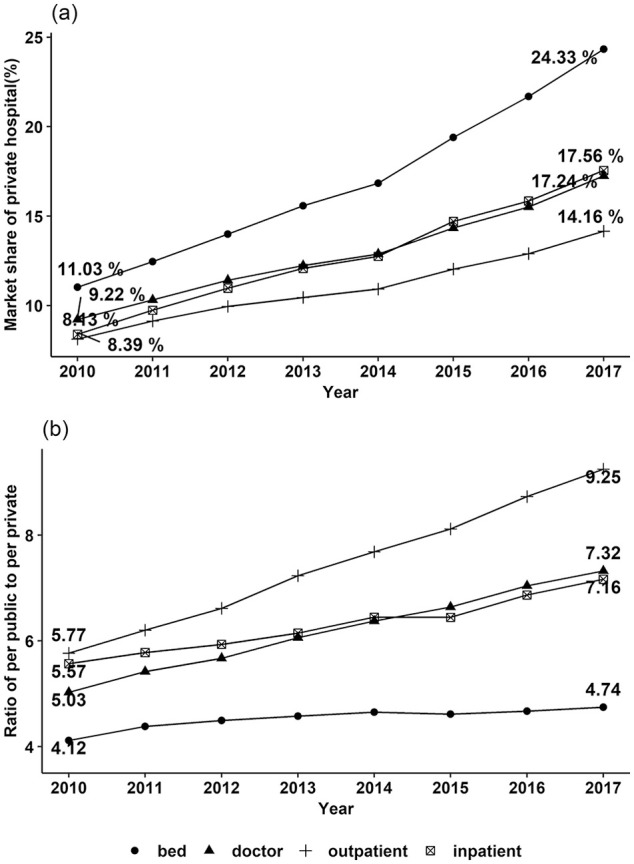
Figure 4.

Hospital capacity and service by ownership types, China, 2010 to 2017.
Note. The number of doctors by ownership in 2009 was not available, hence the line graph only showed data from 2010 to 2017. Subfigure (b) illustrated the ratio of the delivery capacity and service per public hospital owned to that of per private hospital owned respectively.
