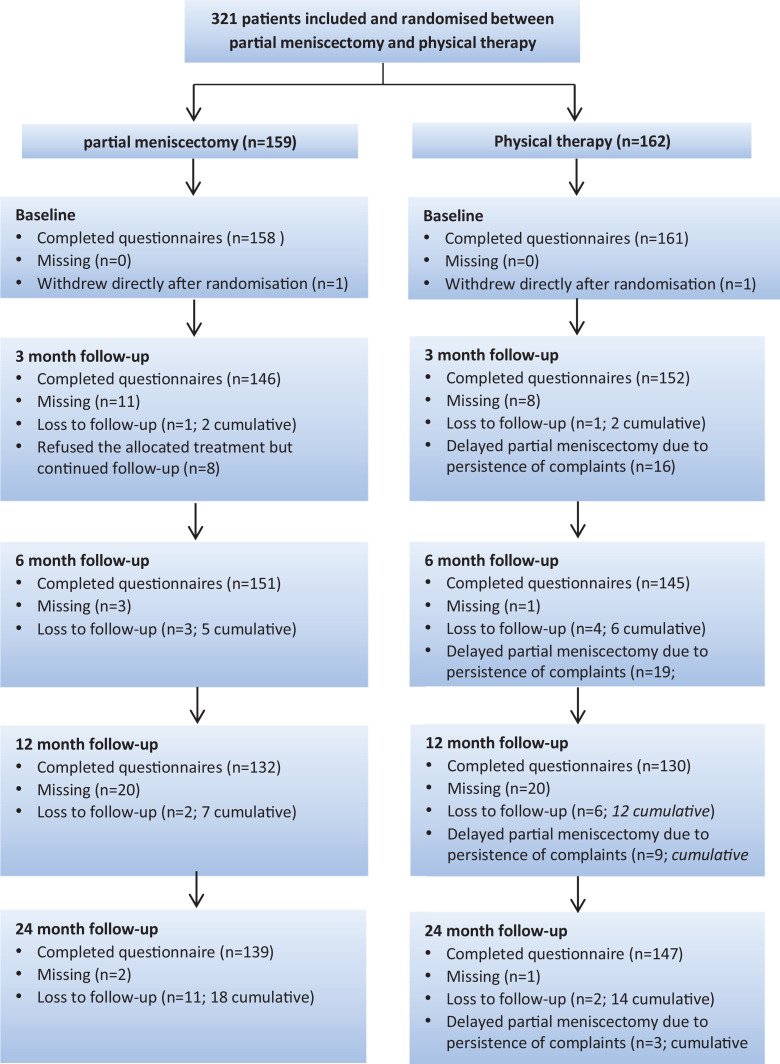
Figure 1.
Flow of patients. The flowchart shows the follow-up data of all patients allocated to a treatment group. The number of missing patients refers to the patients who were missing for a specific follow-up time point. These patients continued participating in the remaining follow-up time points. Patients who dropped out from the trial were referred to as “loss to follow-up.” Data of patients screened for eligibility were not available.

