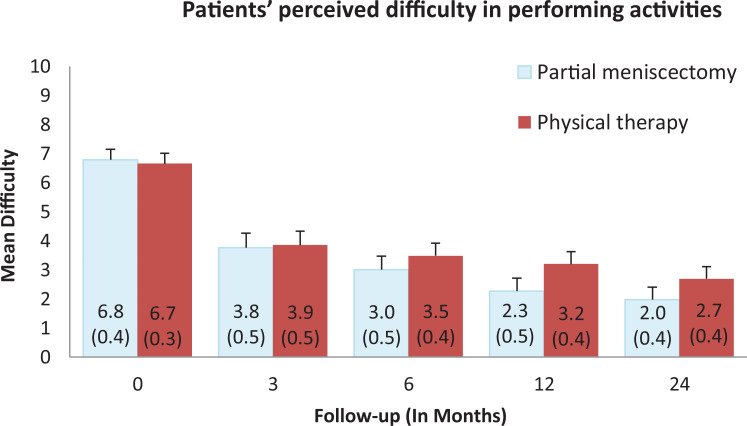
Figure 2.
Mean Patient-Specific Functional Scale (PSFS) scores for each group at baseline and at 3, 6, 12, and 24 months. The mean difficulty scores per group were calculated as the mean of the overall PSFS score per patient, adding the scores for each activity and dividing this by the number of selected activities per patient. Data in parentheses and error bars indicate the 95% CIs.

