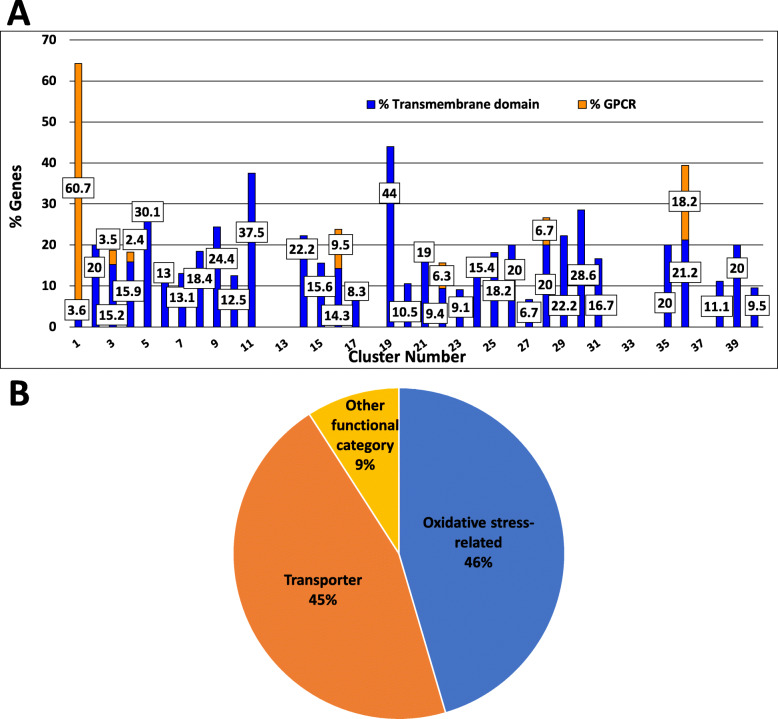
Fig. 5.
Genes encoding proteins with predicted transmembrane domain(s) and/or G protein coupled receptors (GPCRs). a. Transmembrane domains and GPCRs. The percentage of genes in each cluster encoding a protein with at least one predicted transmembrane domain is shown. The orange portion of each bar denotes the percent of genes in each cluster encoding transmembrane proteins that are also predicted G protein coupled receptors (GPCRs). Genes were retrieved using the “Protein targeting and localization - #TM Domains” tool at FungiDB. The numbers on the orange portion of the bars indicate the percent of proteins in a cluster that are GPCRs. The numbers on the blue portion of the bars indicates the percent of proteins in a cluster that have a predicted transmembrane domain. Raw data are available in Additional file 1. b. Functional categories of proteins with transmembrane domains in Cluster 19. Each “slice” of the pie represents the percentage of genes encoding proteins with transmembrane domains in the indicated functional category. Functional category data are available at https://elbe.hki-jena.de/fungifun/fungifun.php

