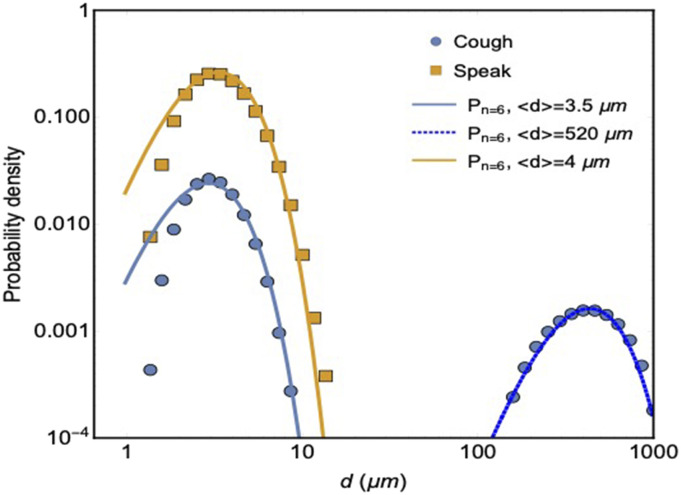
FIG. 1.
Measured drop size distributions of droplets produced when coughing (circles) and speaking (squares). Solid lines are fits with gamma distributions, where P denotes the probability density and n is a measure for the width of the gamma distribution, see Ref. 23 for details.

