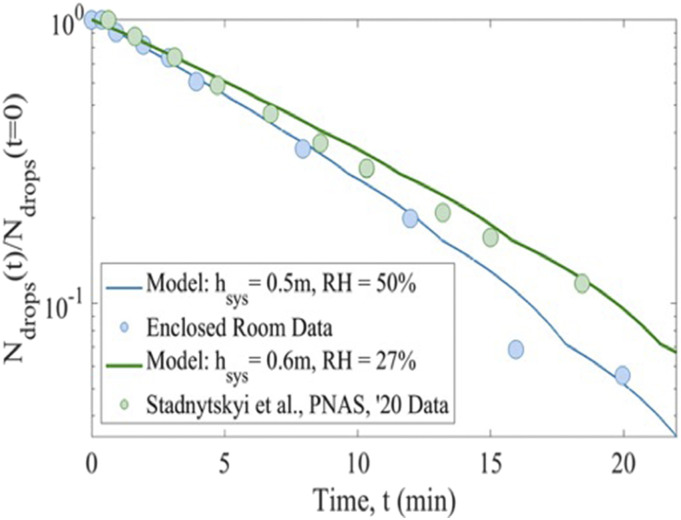
FIG. 4.
Normalized number of droplets as a function of time as determined experimentally (blue circles) compared to the data of Ref. 12 (green circles). Solid lines are model outcomes for both sets of data, with input parameters relative humidity (RH) and system height (hsys).

