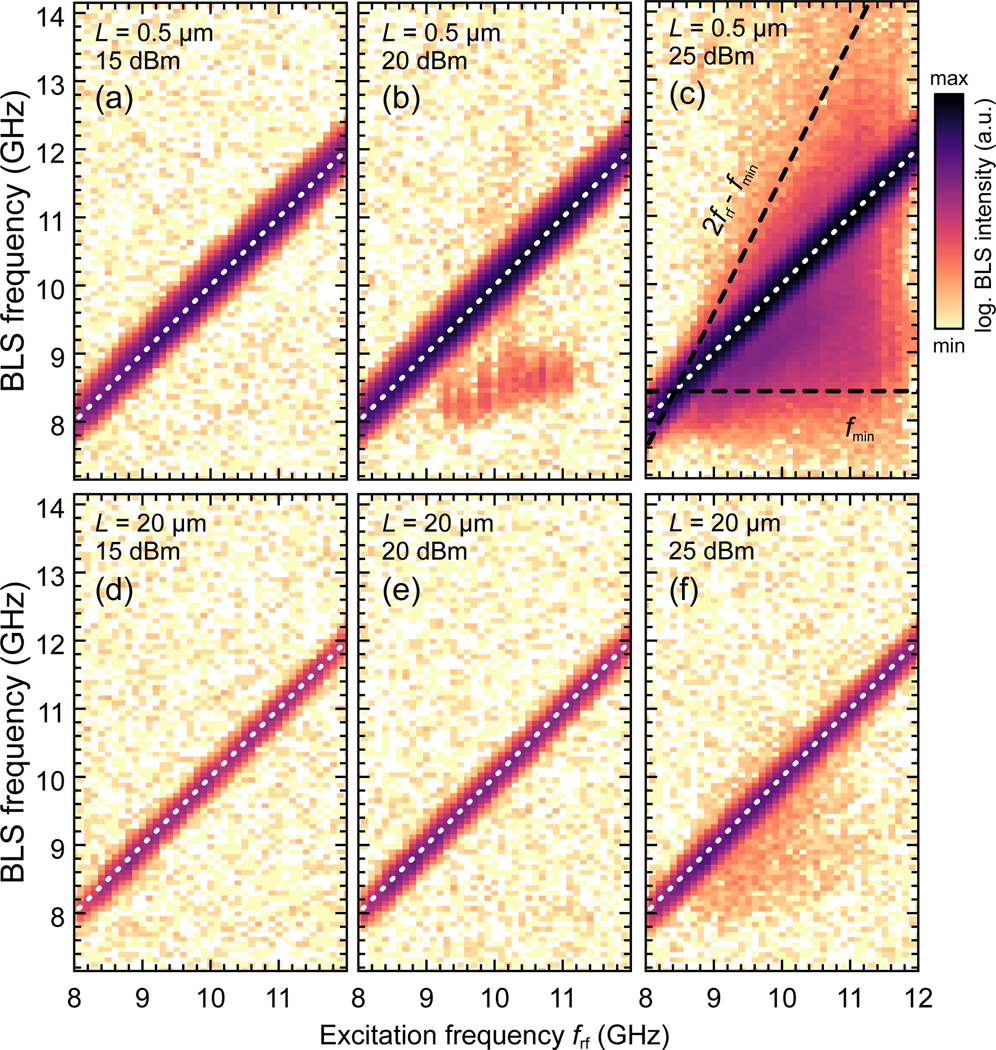
FIG. 2.
μBLS spectra measured in 0.5μm (a-c) and 20μm (d-f) distance to the antenna and at 15dBm (a,d), 20dBm (b,e), and 25dBm (c,f) microwave power. At low powers, the linear response of the magnetization dynamics to the external input dominates (white dotted lines). Especially for the highest power and close to the antenna, four-magnon scattering is apparent, which causes a significant broadening of the excitation spectra. All BLS intensities are plotted on the same logarithmic color scale.

