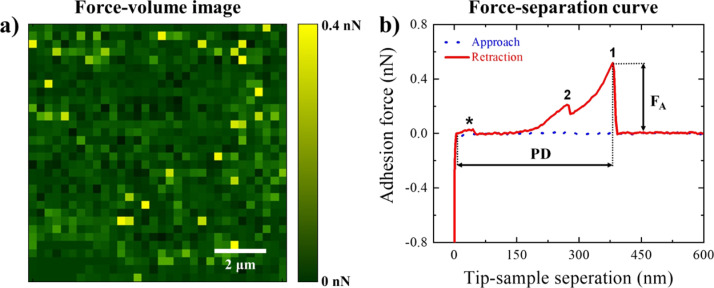
Figure 1.
(a) Example of an FV image and (b) a force–separation curve associated with loose EPS extracted from A. baumannii and subsequently immobilized on a silicon wafer surface. Force magnitudes at each pixel in the FV image represent the maximum adhesion forces (FA) quantified in the retraction force–separation files at that pixel (e.g., peak 1 in the representative retraction curve). The corresponding PDs associated with the biopolymer detachment events were also quantified. While the adhesion forces that possessed values above 0.1 nN cutoff force (e.g., peak 2 in the representative retraction curve) were included in the quantitative analysis, the remaining adhesion events (e.g., peak * in the representative retraction curve) were regarded as noise and excluded from the analysis.

