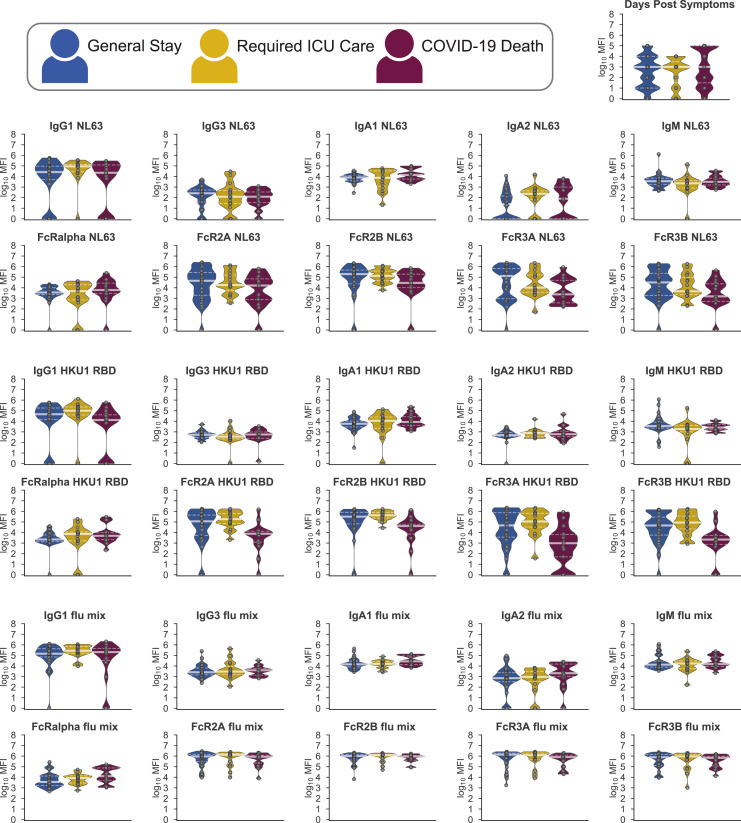
Figure S4.
Pre-existing Coronavirus Immunity, Related to Figure 4
60 plasma samples from hospitalized SARS-CoV-2 infected individuals were profiled against the receptor binding domain of HKU1, NL63, and a mixture of influenza antigens. Distributions of titers across moderate (blue), severe (yellow), and deceased (red) individuals are shown in the violin plot collected within the first five days following symptoms. The solid white line represents the median and the dotted lines the first and third quartiles. A Kruskal-Wallis test was used to evaluate statistical differences across groups for all intervals and features and was corrected for multiple hypothesis testing with the Benjamini-Hochberg procedure. No significant differences were detected.

