
Figure 7.
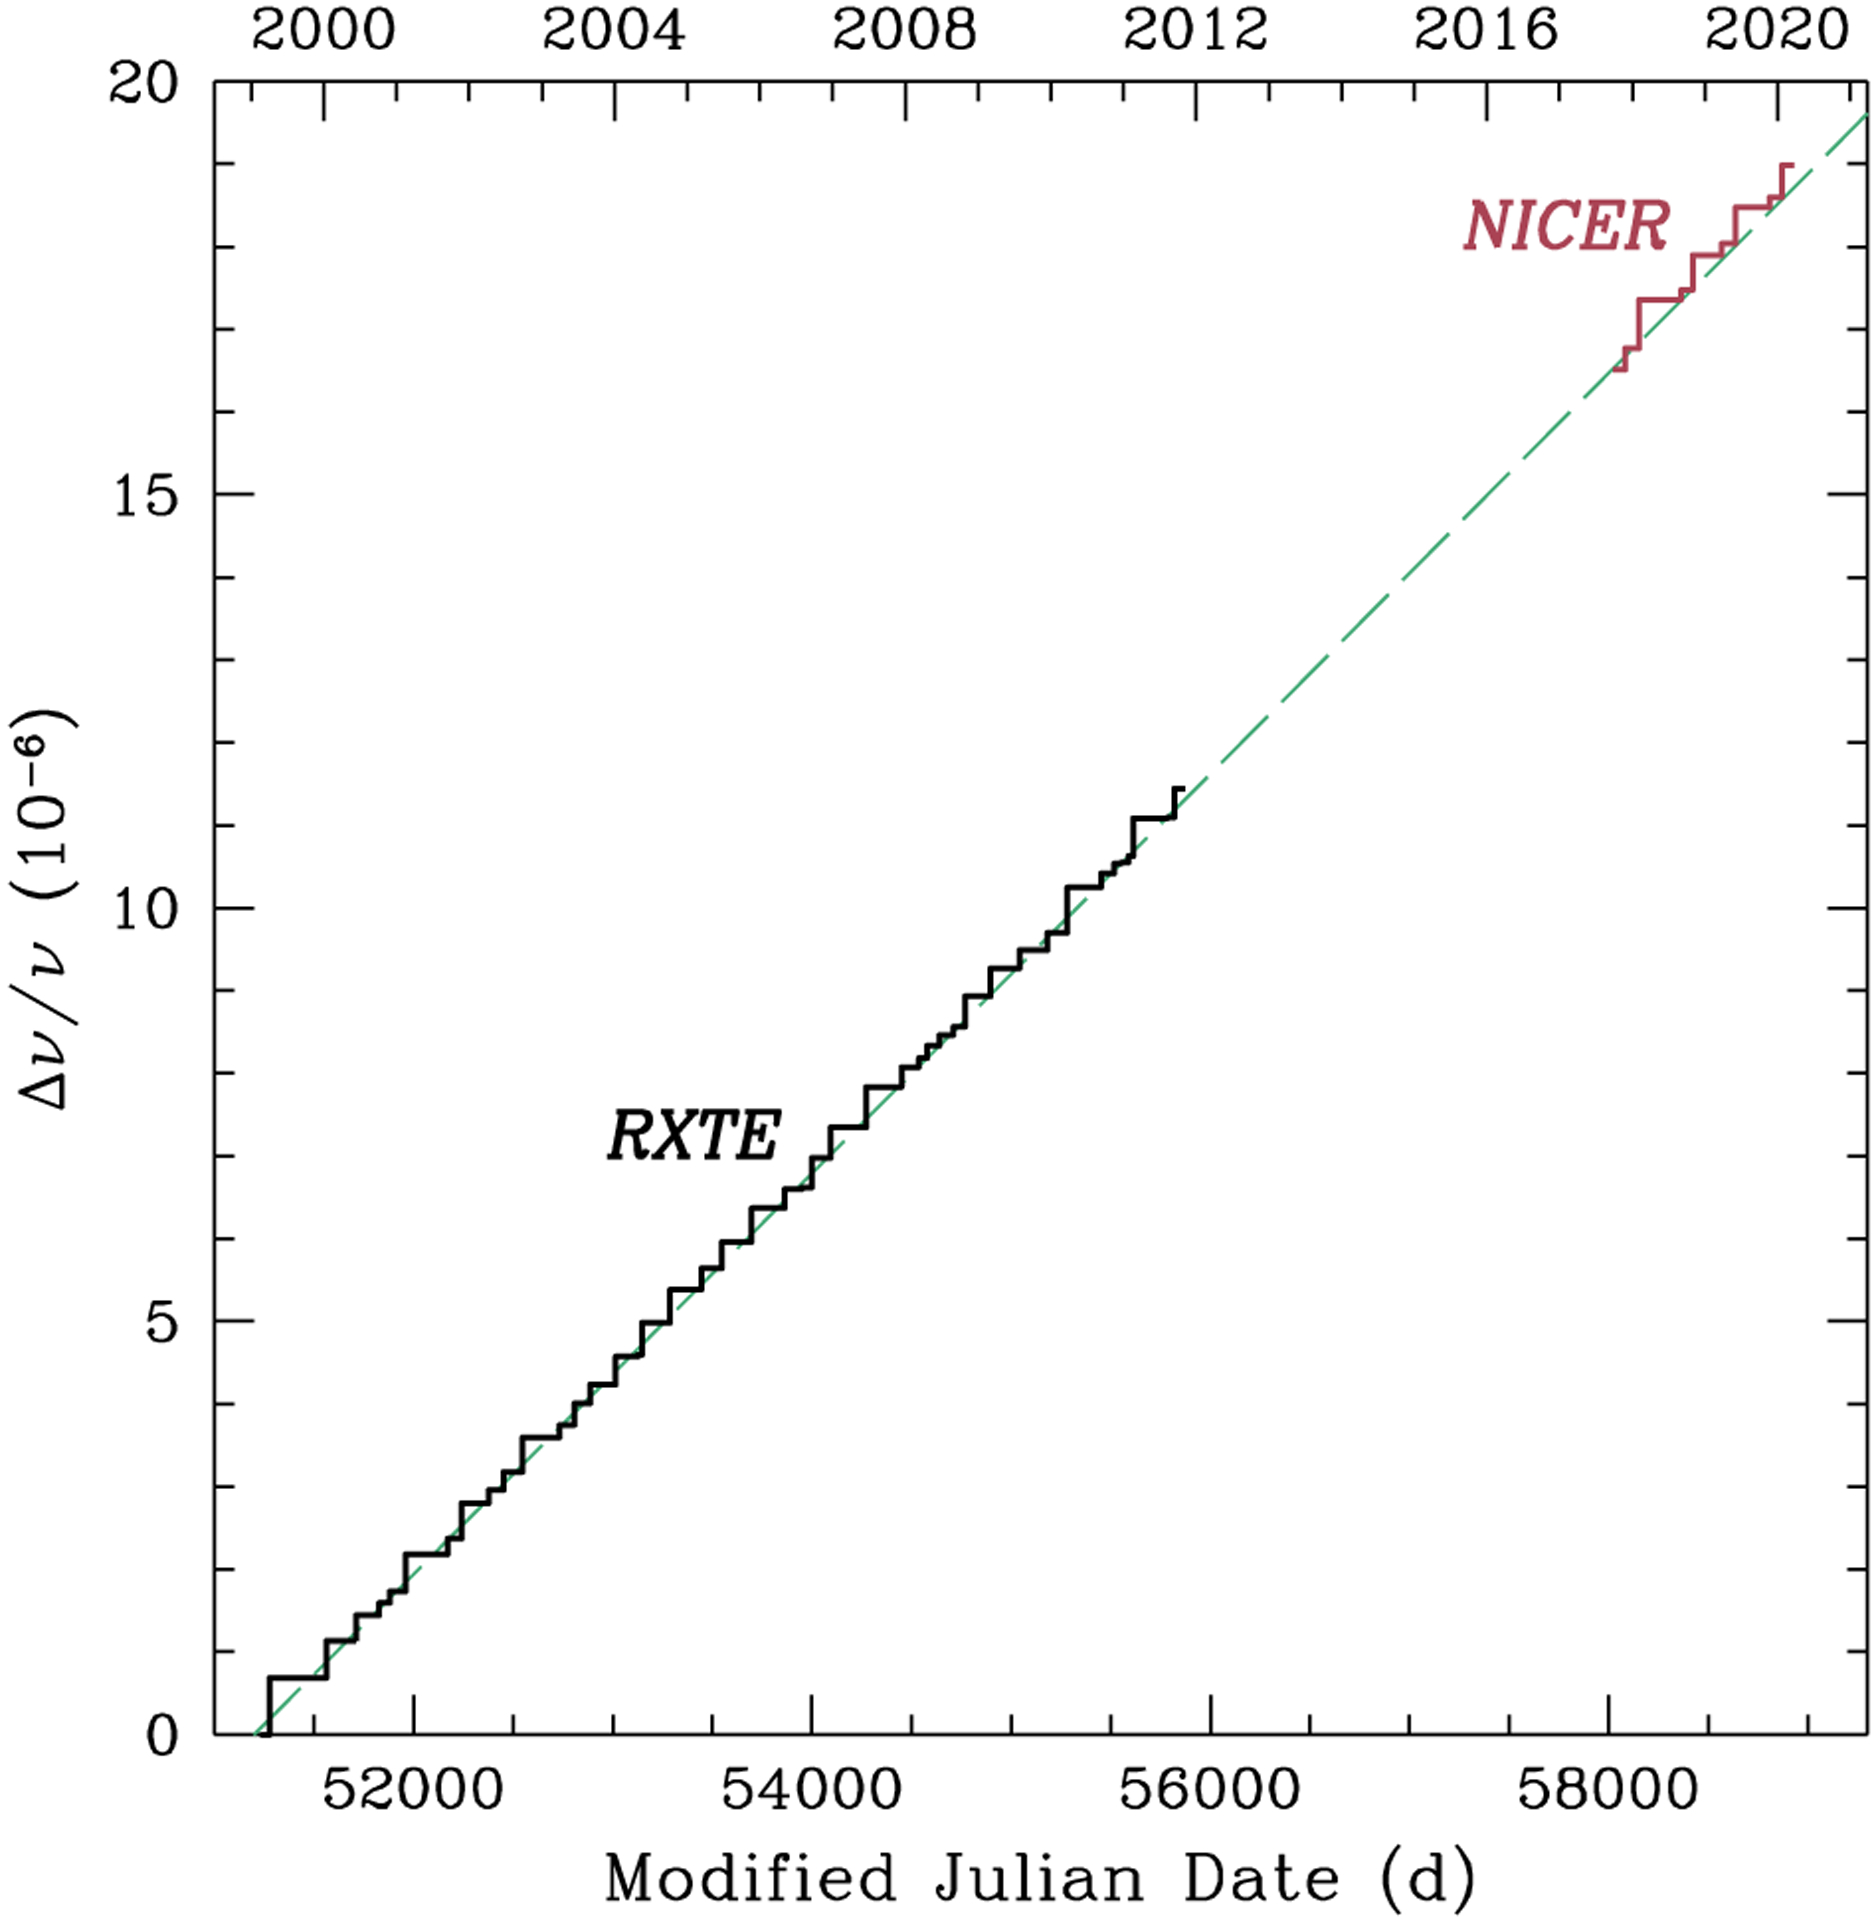
Fractional glitch magnitude Δv/v shown as a cumulative sum over each previous glitch. RXTE values are from Table 2 of Antonopoulou et al. (2018), Dashed line indicates a line with a slope of 8.84 × 10⁻⁷ yr−1, which is the glitch activity Ag ≡ ∑i (Δv/v)i/tobs from RXTE data, where tobs is time over which the pulsar is monitored; note that Ag = 8.88 × 10⁻⁷ yr−1 for the combination of RXTE and NICER glitches. NICER values are offset by Δv/v = 16.5 × 10⁻⁶, i.e., value of dashed line at the epoch of NICER segment 0 at MJD 58020.