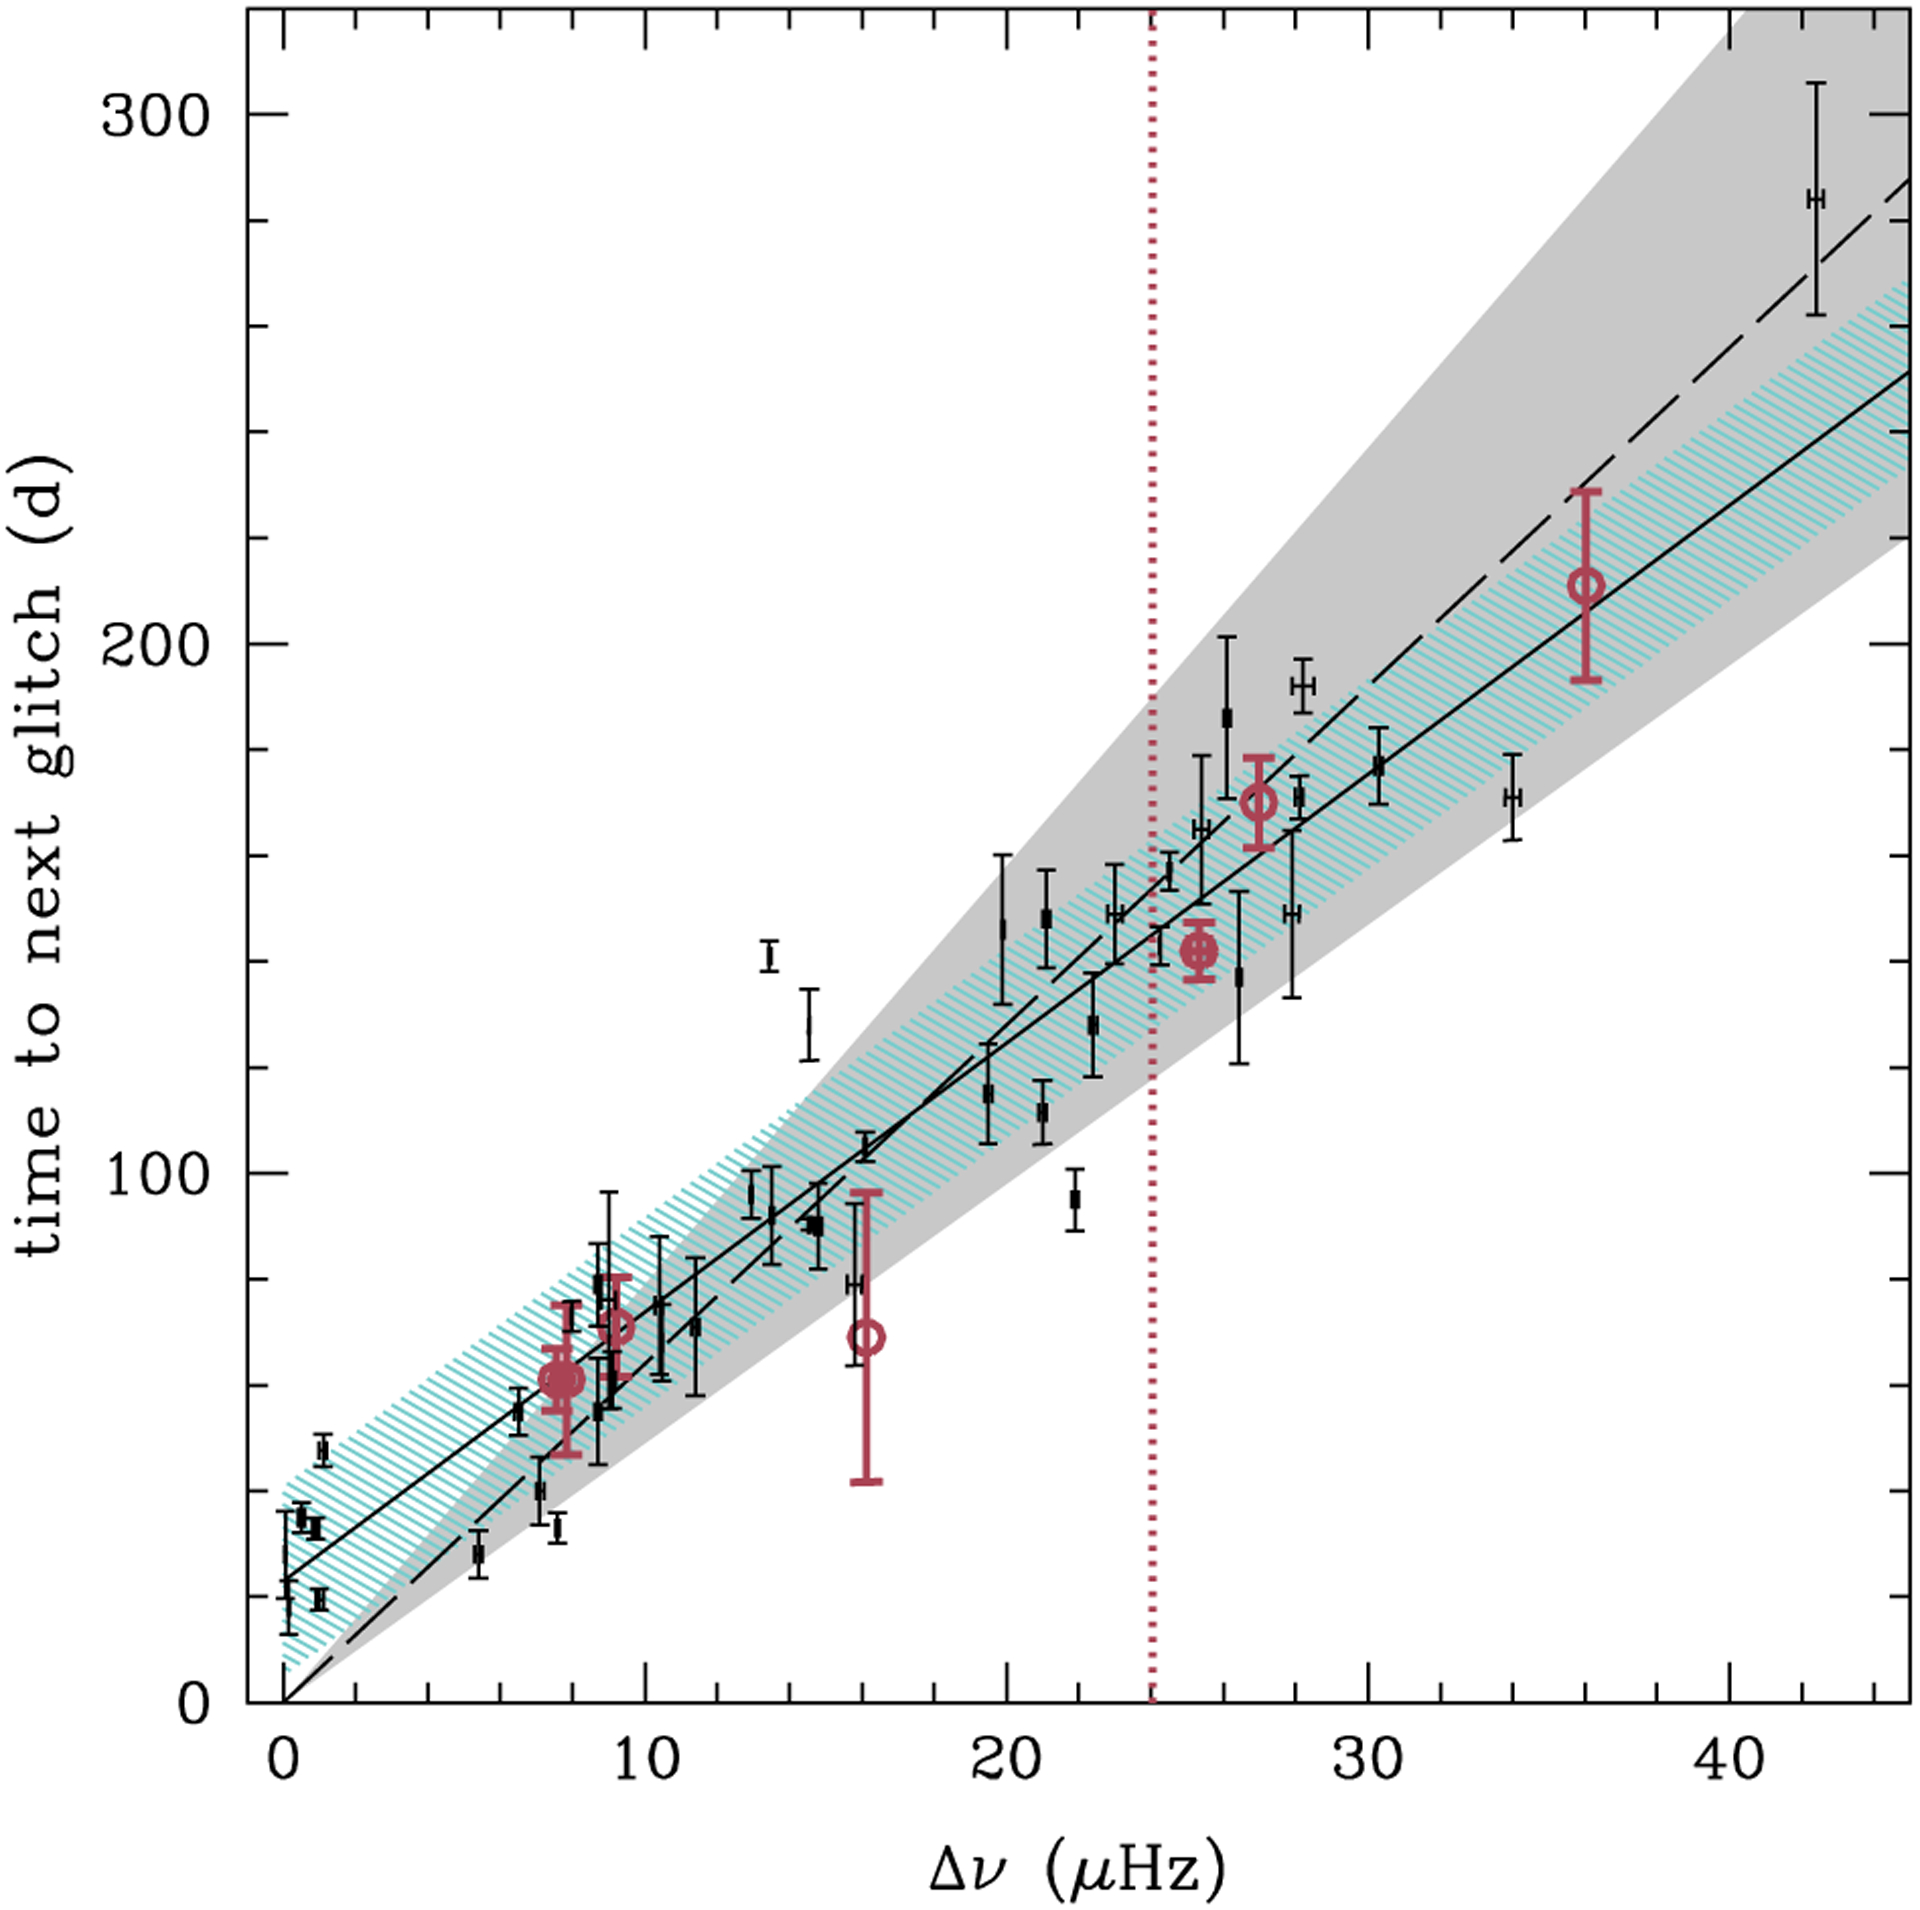
Figure 9.

Time to next glitch as a function of glitch size Δv. Circles with errors are NICER values, and points with errors are RXTE values, which are from Table 2 of Antonopoulou et al. (2018). Vertical dotted line indicates the size of glitch 8, which is the most recent NICER-detected glitch and for which the time to next glitch is not known yet. Errors in Δv are 1σ uncertainty. Solid and dashed lines show a linear fit of NICER and RXTE data with time to next glitch = 6.4 d (Δv/μHz) and time to next glitch = 23 d + 5.08 d (Δv/μHz), respectively, while shading shows correlation regions which fit 68 percent of glitches (see Section 4.2).
