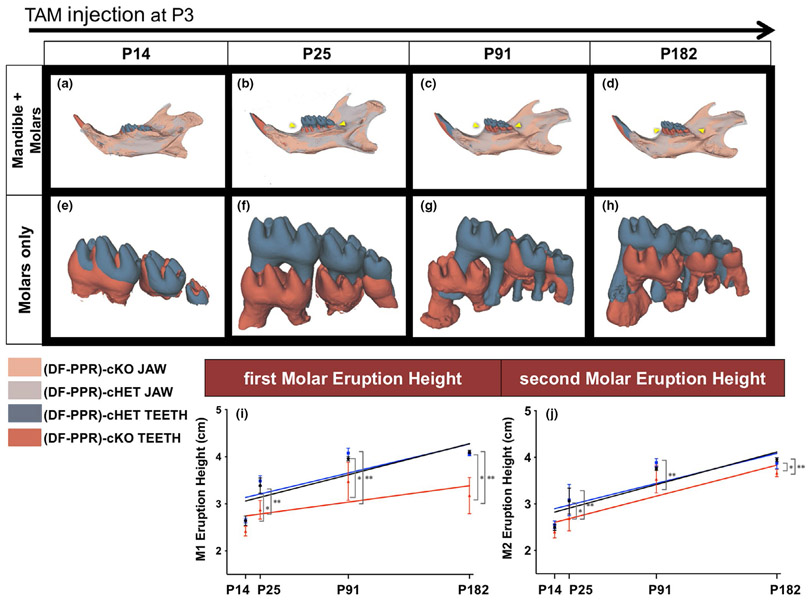
FIGURE 2.
Mouse primary failure of eruption (PFE) molars continue to erupt but at a much slower rate. (a-h) 3D surface model overlays: superimposition of registered dental follicle-specific (DF-PPR) cHet and (DF-PPR) cKO mandibles using mandibular border as a reference structure. At P14 (a,e), P25 (b,f), P91 (c,g) and P182 (d,h) after tamoxifen pulse at P3. Composite 3D computed tomography (CT) images of the mandible, views from the lingual side. Gray and dark gray: jaw and teeth of (DF-PPR) cHet mandible, respectively. Beige and red: jaw and teeth of (DF-PPR) cKO mandible, respectively. Yellow arrowhead: pronounced PFE phenotypes in (DF-PPR) cKO. (i,j) Quantitative 3D-μCT analysis. Eruption height of first molars (M1) (i) and second molars (M2) (j) measured on 3D-μCT images. Colored lines: regression line, black: Control, blue: (DF-PPR) cHet, red: (DF-PPR) cKO. At P14 n = 5, P25 n = 6, P91 and P182 n = 4 **p < .01, *p < .05, One-way ANOVA followed by Mann-Whitney's U test. All data are represented as mean ± SD

