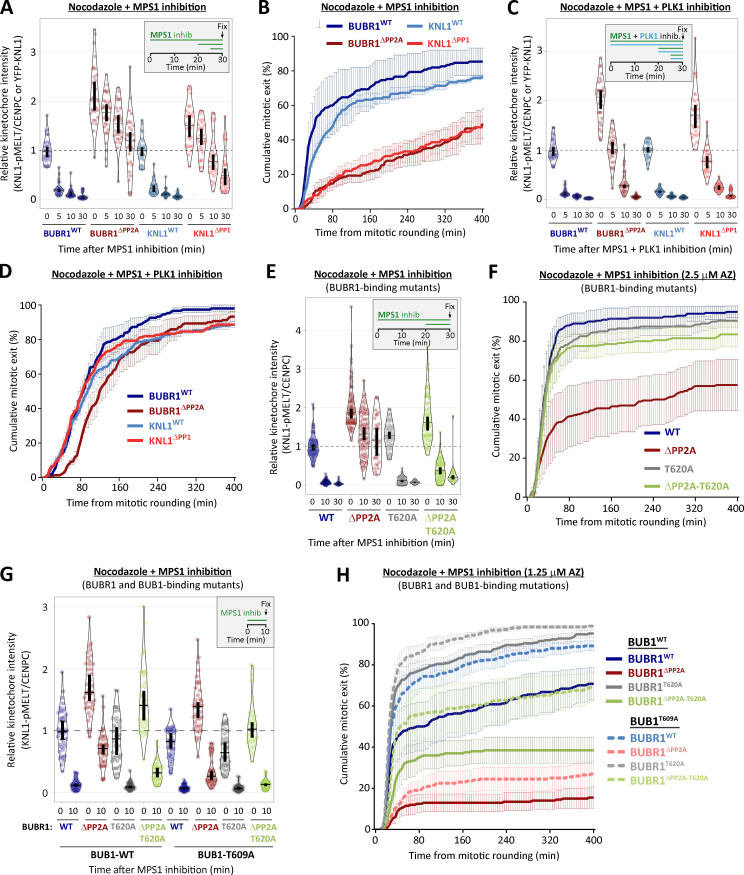
Figure 2.
Kinetochore phosphatases PP1 and PP2A-B56 remove PLK1 from the BUB complex to silence the SAC. (A–D) Effects of phosphatase-binding mutants on KNL1-MELT dephosphorylation (A and C) and duration of mitotic arrest (B and D) in nocodazole-arrested cells treated with MPS1 inhibitor AZ-3146 (2.5 µM) either alone (A and B) or in combination with the PLK1 inhibitor BI-2536 (100 nM; C and D). MG132 was included in all MELT phosphorylation experiments to prevent mitotic exit after addition of the MPS1 inhibitor. A and C display kinetochore intensities from 30 cells per condition, three experiments. Intensities are relative to CENP-C in BUBR1 cells or YFP-KNL1 in KNL1 cells, and all BUBR1 and KNL1 intensities are normalized to their respective WT, 0 min time point. B and D show mean (±SD) of 150 cells per condition from three experiments. (E and F) Effect of mutating the PLK1 binding site on BUBR1 (pT620) on MELT dephosphorylation (E) and mitotic exit (F) in nocodazole-arrested BUBR1WT/ΔPP2A cells, treated as in A and B. E displays kinetochore intensities of 30–80 cells per condition from three to seven experimental repeats. F shows the means (±SD) of 200 cells from four experiments. (G and H) Effect of mutating both PLK1 binding sites BUBR1 (pT620) and BUB1 (pT609) on MELT dephosphorylation (G) and mitotic exit (H) in nocodazole-arrested cells, treated with MPS1 inhibitor AZ-3146 (2.5 µM in G and 1.25 µM in H). The 1.25 µM AZ dose was selected because it is then possible to see effects that weaken or strengthen the WT SAC response (2.5 µM AZ-3146 data are displayed in Fig. S3 I). G displays kinetochore intensities of 40 cells per condition from four experimental repeats, and all intensities are normalized to BUBR1-WT+BUB1-WT control. H shows the means (±SEM) of 200–250 cells from four or five experiments. In all kinetochore intensity graphs, each dot represents the mean kinetochore intensity of a cell, and the violin plots shows the distribution of intensities between cells. The thick vertical lines represent a 95% CI around the median, which can be used for statistical comparison of multiple time points/treatments by eye (see Materials and methods). Timelines indicate treatment regimen before fixation.

