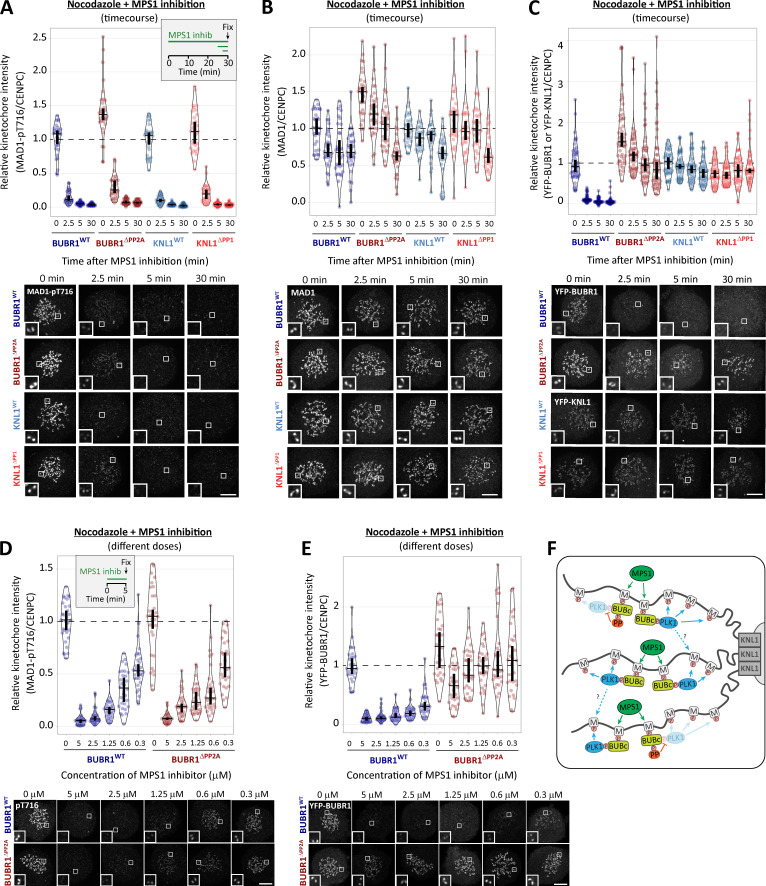
Figure 3.
PP1 and PP2A-B56 removal from kinetochores does not affect dephosphorylation of MAD1-pT716 following MPS1 inhibition. (A) Effects of phosphatase-binding mutants on MAD1-pT716 dephosphorylation in nocodazole-arrested cells treated with MPS1 inhibitor AZ-3146 (2.5 µM), as indicated in the timeline. Graph displays kinetochore intensities of 30 cells per condition from three experimental repeats. (B and C) Total MAD1 (B) and YFP (C) levels in phosphatase-binding mutants treated as in A. B displays kinetochore intensities of 30 cells per condition from three experimental repeats, and C is derived from 60 cells, six experiments. (D and E) MAD1-pT716 (D) and YFP-BUBR1 (E) kinetochore levels after 5 min of MPS1 inhibition with different concentrations of AZ-3146 (0.3–5 µM) in nocodazole-arrested cells. Graphs display kinetochore intensities of 30 cells, three experiments. (F) Schematic model to illustrate how PLK1 recruitment to multiple MELT motifs can amplify the SAC signal. M, MELT motif; BUBc, BUB complex; PP, PP2A-B56. In all kinetochore intensity graphs, each dot represents the mean kinetochore intensity of a cell, and the violin plots shows the distribution of mean intensities between cells. The thick vertical lines represent a 95% CI around the median, which can be used for statistical comparison of multiple time point/treatments by eye (see Materials and methods). Timelines indicate treatment regimen before fixation. MG132 was included in combination with MPS1 inhibitor in every case to prevent mitotic exit. Representative images were chosen that most closely resemble the mean values in the quantifications. The insets show magnifications of the outlined regions. Scale bars, 5 µm. Inset size, 1.5 µm.

