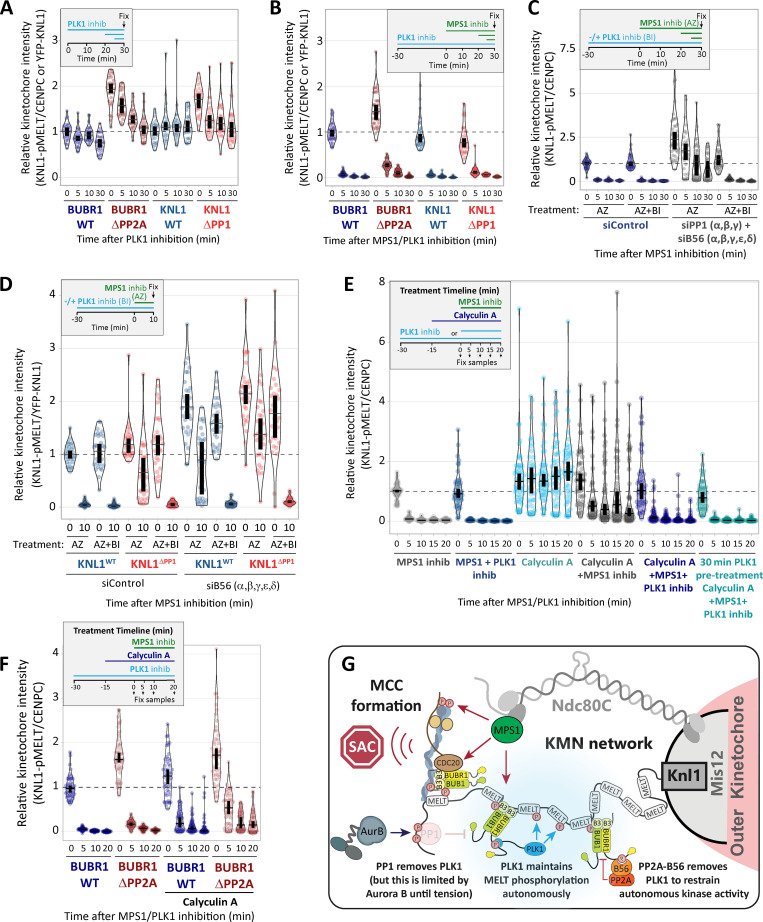
Figure 4.
PP1/PP2A inhibition cannot prevent MELT dephosphorylation if MPS1 and PLK1 are inhibited together. (A and B) Effects of phosphatase-binding mutants on KNL1-MELT dephosphorylation in nocodazole-arrested cells treated with PLK1 inhibitor BI-2536 (100 nM) alone (A) or in combination with MPS1 inhibitor AZ-3146 (2.5 µM; B), as indicated in the timelines. Intensities are relative to CENP-C in BUBR1 cells or YFP-KNL1 in KNL1 cells, and all BUBR1 and KNL1 intensities are normalized to their respective WT, 0 min time point. (C and D) KNL1-MELT phosphorylation levels following combined siRNA-mediated knockdown of all PP1 and B56 isoforms (C) or all B56 isoforms in KNL1WT/ΔPP1 cells (D). The quantifications are from nocodazole-arrested cells treated with MPS1 inhibitor AZ-3146 (2.5 µM) alone or in combination with PLK1 inhibitor BI-2536 (100 nM), as indicated. Representative images are displayed in Fig. S4, D and G. (E) KNL1-MELT dephosphorylation in Hela FRT cells arrested in nocodazole treated with kinase inhibitors in the presence or absence of the PP1/PP2A phosphatase inhibitor calyculin A (25 nM), as indicated. Representative images are displayed in Fig. S4 H. (F) Effects of PP2A-binding mutants in combination with the PP1/PP2A phosphatase inhibitor calyculin A (25 nM) on pMELT dephosphorylation in nocodazole-arrested cells treated with PLK1 (100 nM BI-2536) and MPS1 (2.5 µM AZ-3146) inhibitors, as indicated in the timeline. Representative images are displayed in Fig. S4 I. In all kinetochore intensity graphs, each dot represents the mean kinetochore intensity of a cell, and the violin plots shows the distribution of mean intensities between cells. The thick vertical lines represent a 95% CI around the median, which can be used for statistical comparison of multiple time point/treatments by eye (see Materials and methods). A–D derived from 30–40 cells per condition, three or four experiments. E and F display 40–50 cells, four or five experiments. Timelines indicate treatment regimen before fixation. MG132 was included in whenever MPS1 was inhibited to prevent mitotic exit. (G) Schematic model to show how kinetochore phosphatases restrain (PP2A) or extinguish (PP1) autonomous PLK1 activity to control the SAC. MCC, mitotic checkpoint complex.

