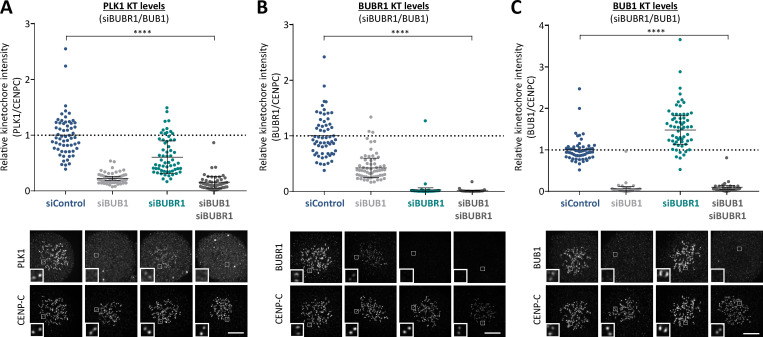
Figure S1.
Effect of BUB1/BUBR1 knockdown in PLK1, BUBR1, and BUB1 kinetochore levels (related to Fig. 1). (A–C) Relative kinetochore levels of PKL1 (A), BUBR1 (B), and BUB1 (C) after siRNA-mediated depletion of BUB1, BUBR1, or both BUB1 and BUBR1 combined in HeLa FRT cells. Graphs show the mean kinetochore intensity of 40–60 cells per condition, four experiments. For all kinetochore intensity graphs, each dot represents a cell, and the error bars display the variation between the experimental repeats (displayed as ±SD of the experimental means). Two-tailed, nonparametric Mann-Whitney unpaired t tests were performed to compare the means values between experimental groups. Example immunofluorescence images were chosen that most closely resemble the mean values in the quantifications. The insets show magnifications of the outlined regions. Scale bars, 5 µm. Inset size, 1.5 µm. ****, P < 0.0001.

