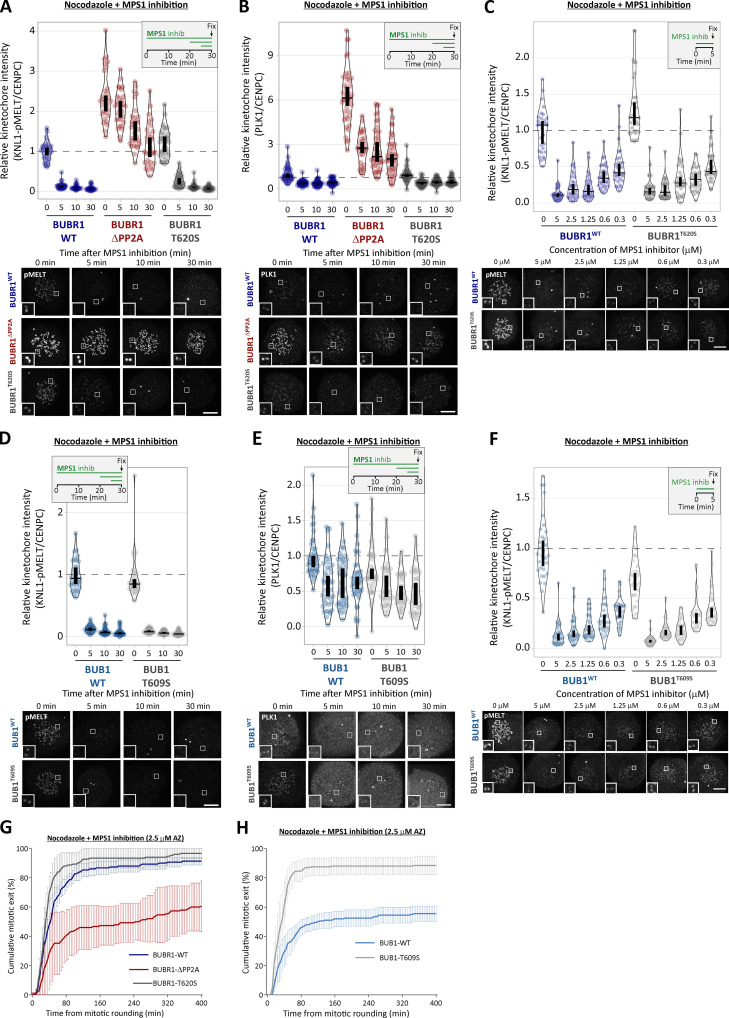
Figure S10.
Thr-to-Ser conversion in the PBM of BUB1 or BUBR1 does not increase PLK1 levels or delay MELT dephosphorylation after MPS1 inhibition (related to Fig. 5). (A and B) Effect of Thr-to-Ser conversion in BUB1 (T609S) on kinetochore levels of pMELT (A) and PLK1 (B) after MPS1 inhibition with 2.5 µM AZ-3146. A shows 30 cells per condition from three experiments, and B represents 30–40 cells from three or four experiments. (C) MELT phosphorylation levels in BUB1-T609S cells after 5 min of MPS1 inhibition with different concentrations of AZ-3146 (0.3–5 µM) in nocodazole-arrested cells. Graphs display kinetochore intensities of 30 cells, three experiments. (D and E) Effect of Thr-to-Ser conversion in BUBR1 (T620S) in pMELT (D) and PLK1 (E) levels after MPS1 inhibition (2.5 µM AZ-3146). D represents 30 cells from three experiments, and E shows 40 cells from four experiments. (F) MELT phosphorylation levels in BUBR1-T620S cells after 5 min of MPS1 inhibition with different concentrations of AZ-3146 (0.3–5 µM) in nocodazole-arrested cells. Graphs display kinetochore intensities of 20–30 cells, two or three experiments. (G and H) Effect of BUBR1-T620S (G) and BUB1-T609S (H) mutations on mitotic exit in nocodazole-arrested cells treated with MPS1 inhibitor (2.5 µM AZ-3146). G shows the means (±SEM) of 150 cells from three experiments, and H shows 200 cells from four experiments. MG132 was included in combination with MPS1 inhibitor in every case to prevent mitotic exit. For all graphs, each dot represents a cell, and vertical bars show 95% CIs. All images were chosen that most closely resemble the mean values in the quantifications. Scale bars, 5 µm. Inset size, 1.5 µm.

