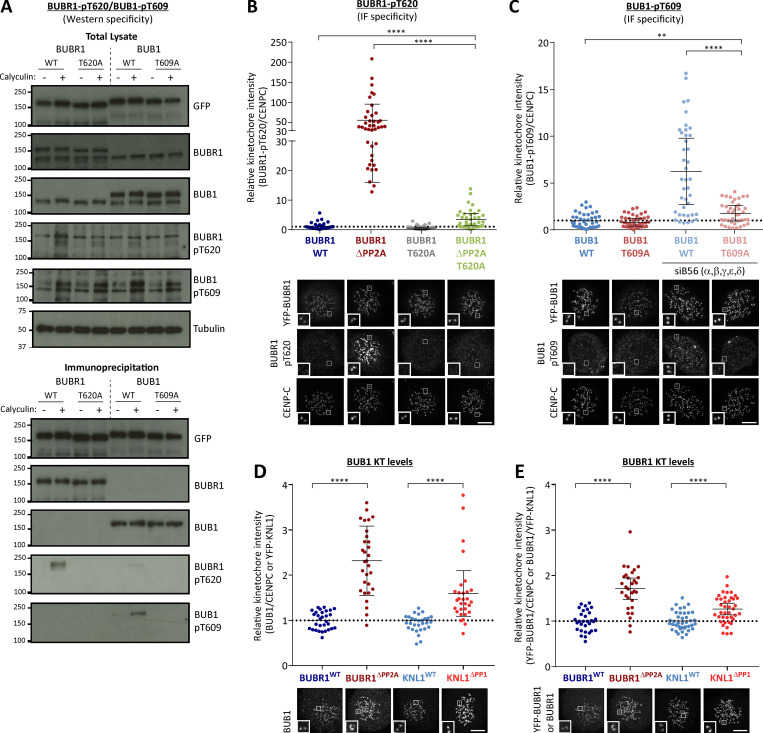
Figure S2.
Testing specificity of phospho-specific antibodies in cells and quantification of kinetochore BUB1 and BUBR1 levels in phosphatase-binding mutants (related to Fig. 1). (A) Mitotic cells expressing exogenous BUB1 and BUBR1 constructs were treated with/without 50 nM calyculin for 20 min before harvesting for lysis to maximally phosphorylate BUB1/BUBR1. YFP-tagged BUB1 and BUBR1, mutated in the Polo-box binding sites, were immunoprecipitated and blotted with indicated antibodies. Blots from a single experiment were chosen that best represent three independent experiments. (B and C) Effect of mutating the Polo-box binding motifs (BUBR1T620A and BUB1T609A) on antibody detection of BUBR1 pT620 (B) and BUB1 pT609 (C) by immunofluorescence. These experiments were performed in combination with either mutating the phosphatase binding motif on BUBR1 (B) or siRNA-mediated knockdown of all B56 isoforms (C) to elevate BUBR1/BUB1 phosphorylation to maximal levels. The graphs show the mean kinetochore intensity of 40 cells from four experiments. (D and E) Kinetochore quantification of BUB1 (D) and BUBR1 (E) levels in phosphatase-binding mutants. D displays 30 cells from three experiments, and E shows 30–40 cells from two or three experiments. For all kinetochore intensity graphs, each dot represents a cell, and the error bars display the variation between the experimental repeats (displayed as ±SD of the experimental means). Two-tailed, nonparametric Mann-Whitney unpaired t tests were performed to compare the means values between experimental groups. Example immunofluorescence images were chosen that most closely resemble the mean values in the quantifications. The insets show magnifications of the outlined regions. Scale bars, 5 µm. Inset size, 1.5 µm. **, P < 0.01; ****, P < 0.0001.

