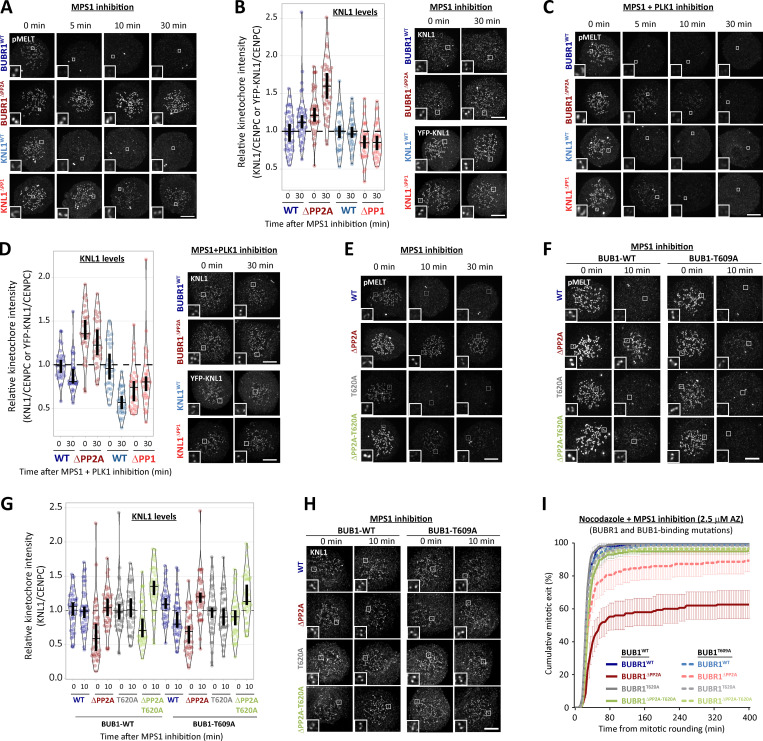
Figure S3.
PLK1 inhibition or removal from BUB complex restores SAC silencing in the phosphatase-binding mutants (related to Fig. 2). (A) Example immunofluorescence images of the kinetochore quantifications shown in Fig. 2 A. (B) Representative images and quantification of KNL1 (BUBR1WT/ΔPP2A cells) or YFP-KNL1 (KNL1WT/ΔPP1 cells) after MPS1 inhibition with AZ-3146 (2.5 µM), as in Fig. 2 A. Graph represents 40 cells from four experiments. (C) Representative immunofluorescence images of quantifications shown in Fig. 2 C. (D) Representative images and quantification of KNL1 (BUBR1 cells) or YFP-KNL1 (KNL1 cells) after MPS1 inhibition with AZ-3146 (2.5 µM) in combination with the PLK1 inhibitor BI-2536 (100 nM), as in Fig. 2 C. Graph represents 30 cells from three experiments. (E and F) Example immunofluorescence images of the kinetochore quantifications shown in Fig. 2 E (E) and Fig. 2 G (F). (G and H) Quantification of KNL1 levels (G) and representative images (H) of BUBR1/BUB1 Polo-box–binding mutants treated with MPS1 inhibitor (2.5 µM AZ-3146), as in Fig. 2 G. Graph shows median of 40 cells per condition from four experiments. (I) Effect of mutating both PLK1 binding sites BUBR1 (pT620) and BUB1 (pT609) on mitotic exit in nocodazole-arrested cells, treated with MPS1 inhibitor AZ-3146 (2.5 µM). Graph shows the means (±SEM) of 150–200 cells from three or four experiments. The images were chosen that most closely resemble the mean values in the quantifications. The insets show magnifications of the outlined regions. Scale bars, 5 µm. Inset size, 1.5 µm.

