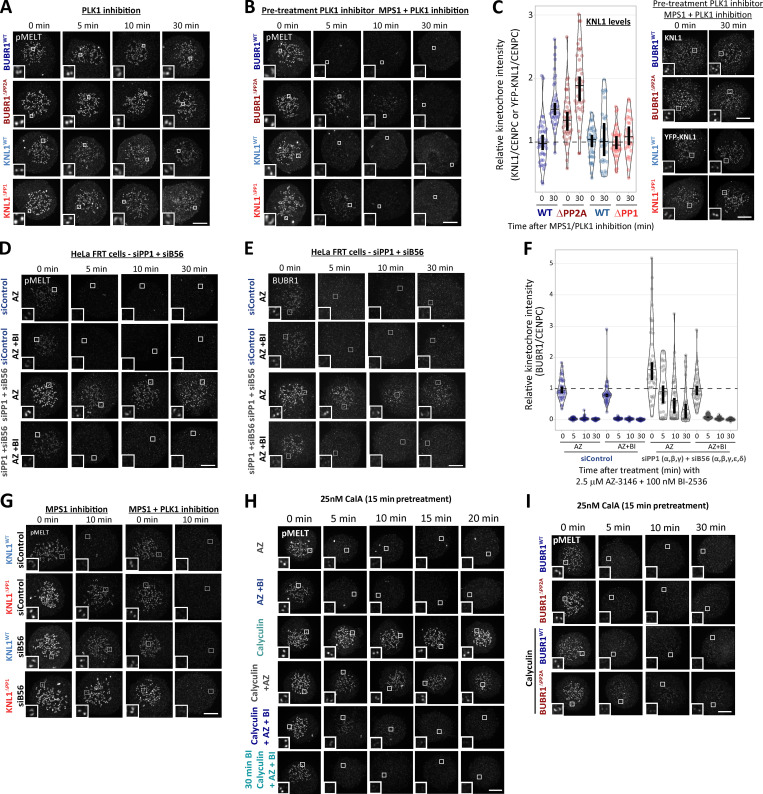
Figure S4.
Representative images from kinetochore quantifications in Fig. 4. (A and B) Example immunofluorescence images of the kinetochore quantifications shown in Fig. 4 A (A) and Fig. 4 B (B). (C) Representative images and quantification of KNL1 (BUBR1 cells) or YFP-KNL1 (KNL1 cells) after 30 min pretreatment with PLK1 inhibitor followed by coinhibition with MPS1 and PLK1 inhibitors, as in Fig. 4 B. Graph represents 40 cells from four experiments. (D–F) Immunofluorescence images of pMELT (D) and BUBR1 (E), and kinetochore quantification BUBR1 (F) from cells treated as in Fig. 4 C. Graph shows median of 30–40 cells per condition from three or four experiments. (G–I) Representative immunofluorescence images of the kinetochore quantifications shown in Fig. 4 D (G), Fig. 4 E (H), and Fig. 4 F (I). MG132 was included in combination with MPS1 inhibitor in every case to prevent mitotic exit. For all graphs, each dot represents a cell, and vertical bars show 95% CIs. All images were chosen that most closely resemble the mean values in the quantifications. Scale bars, 5 µm. Inset size, 1.5 µm.

