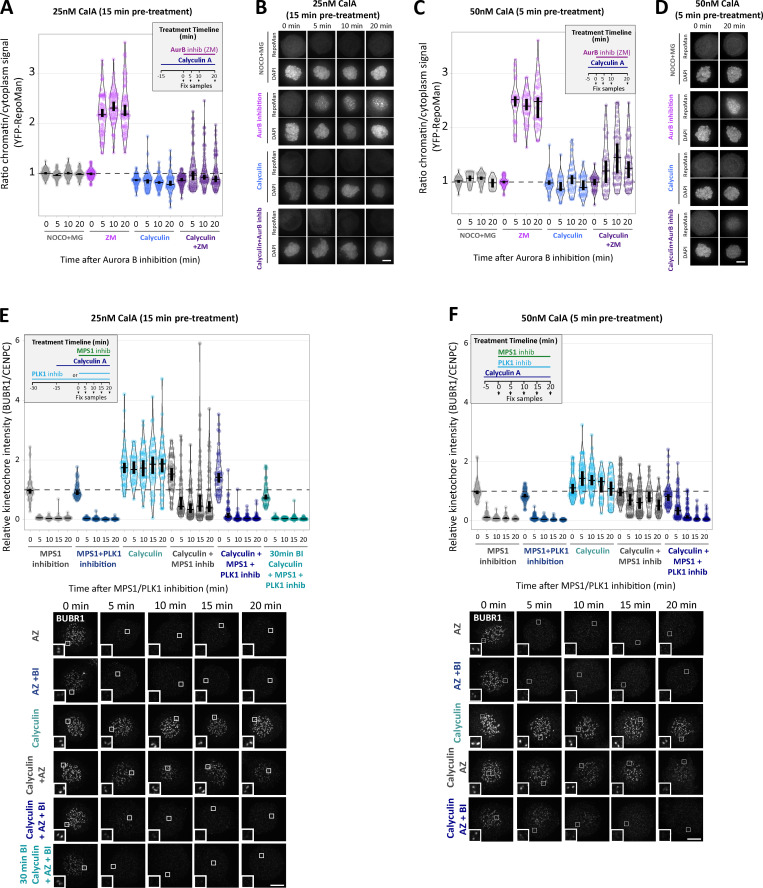
Figure S5.
Example images and kinetochore quantification of BUBR1 and RepoMan after calyculin A treatment with 25 nM and 50 nM doses (related to Fig. 4). (A–D) Quantifications (A and C) and representative images (B and D) of YFP-RepoMan signal on chromatin and cytoplasm to confirm phosphatase inhibition with 25 nM calyculin A (A and B) or 50 nM calyculin A (C and D) treatment regimens. Panel A represents 70 cells from four experiments, and C represents 20–45 cells from two or three experiments. (E) Kinetochore BUBR1 quantifications from cells treated with 25 nM calyculin A as in Fig. 4 E. Graph shows median of 40–50 cells per condition from four or five experiments. (F) Kinetochore levels of BUBR1 after phosphatase inhibition with 50 nM calyculin A. Graph represents 30–60 cells per condition from three to six experiments. MG132 was included in combination with MPS1 inhibitor in every case to prevent mitotic exit. For all graphs, each dot represents a cell, and vertical bars show 95% CIs. All images were chosen that most closely resemble the mean values in the quantificaions. The insets show magnifications of the outlined regions. Scale bars, 5 µm. Inset size, 1.5 µm.

