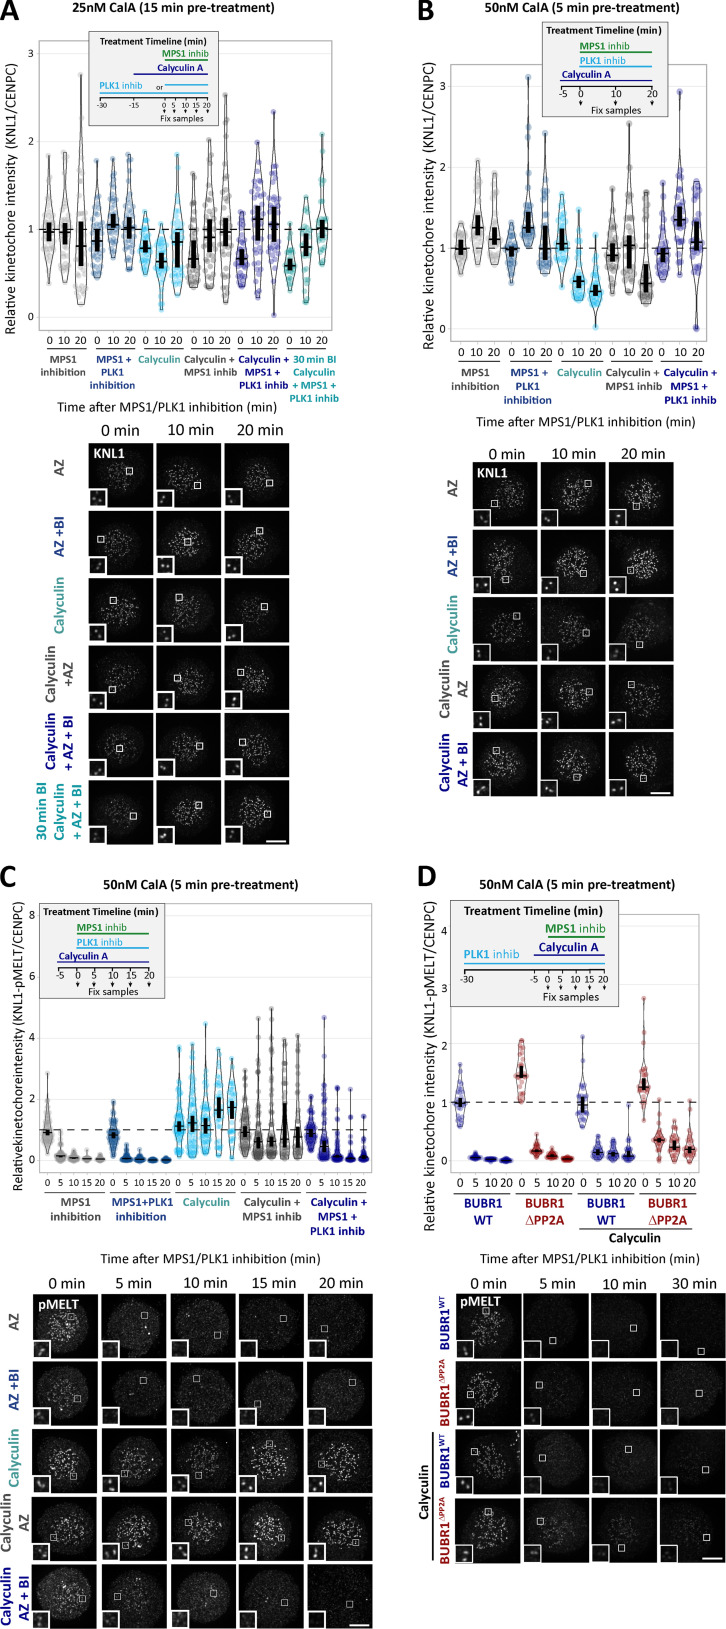
Figure S6.
Example images and kinetochore quantification KNL1 and KNL1-pMELT after calyculin A treatment with 25 nM and 50 nM doses (related to Fig. 4). (A) Quantification of KNL1 levels in cells treated with 25 nM calyculin as in Fig. 4 E. Graph shows 30–40 cells per condition from three or four experiments. (B and C) Kinetochore levels of KNL1 (B) and pMELT (C) after treatment with 50 nM calyculin A. B displays 30 cells from three experiments, and C represents 50–70 cells from five to seven experiments. (D) Effects of PP2A-binding mutants in combination with the PP1/PP2A phosphatase inhibitor calyculin A (50 nM) on pMELT dephosphorylation in nocodazole-arrested cells treated with PLK1 (100 nM BI-2536) and MPS1 (2.5 µM AZ-3146) inhibitors, as indicated in the timeline. Graph displays kinetochore intensities of 30 cells per condition from three experimental repeats. MG132 was included in combination with MPS1 inhibitor in every case to prevent mitotic exit. For all graphs, each dot represents a cell, and vertical bars show 95% CIs. All images were chosen that most closely resemble the mean values in the quantifications. The insets show magnifications of the outlined regions. Scale bars, 5 µm. Inset size, 1.5 µm.

