Figure 2.
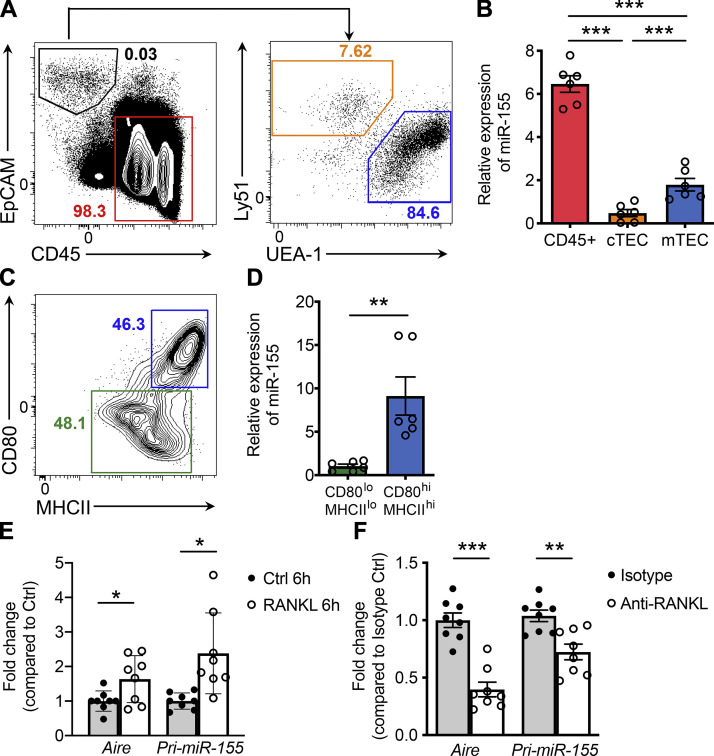
RANKL stimulation results in elevated miR-155 expression in mature mTECs. (A) Representative FACS profiles with gating strategy for different thymic subsets are shown. Hematopoietic cells were defined as CD45+EpCAM−. TECs were defined as CD45−EpCAM+ and further divided into cTEC (Ly51+UEA-1−) and mTEC (Ly51−UEA-1+) populations. (B) qPCR analyses of miR-155 expression in hematopoietic cells, cTECs, and mTECs. (C) Immature and mature mTECs within the mTEC population were further discriminated based on the levels of expression of CD80 and MHCII molecules. (D) qPCR analyses of miR-155 expression in CD80loMHCIIlo immature mTECs and CD80hiMHCIIhi mature mTECs. (E and F) qPCR analyses for Aire and pri-miR-155 expressions in sorted primary immature mTECs stimulated with 500 ng/ml RANKL for 6 h in vitro (E) or in total mTECs isolated from mice administrated with anti-RANKL or isotype control antibodies (F). The n-fold changes on the basis of corresponding untreated control groups were shown. Each symbol represents an individual mouse, and the bar represents the mean. Data are pooled from at least three independent experiments. Results of Student’s t test: *, P < 0.05; **, P < 0.01; ***, P < 0.001.

