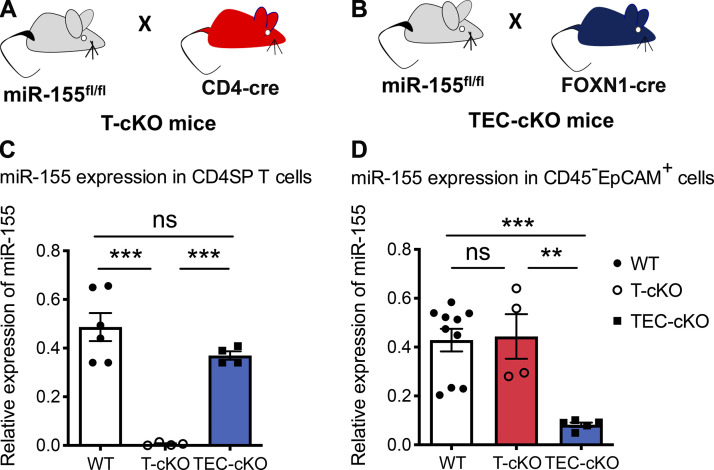
Figure S1.
Generation of T-cKO and TEC-cKO mice. (A and B) Schematic of the generation of T-cKO (A) and TEC-cKO (B) mice. (C and D) qPCR analyses of the expression of miR-155 in CD4SP T cells (CD4+CD8−; C) and TECs (CD45−EpCAM+; D) isolated from the thymus of 5–6-wk-old WT, T-cKO, and TEC-cKO mice. Each symbol represents an individual mouse, and the bar represents the mean. Data are pooled from at least three independent experiments. Results of Student’s t test: **, P < 0.01; ***, P < 0.001; ns, not significant.

