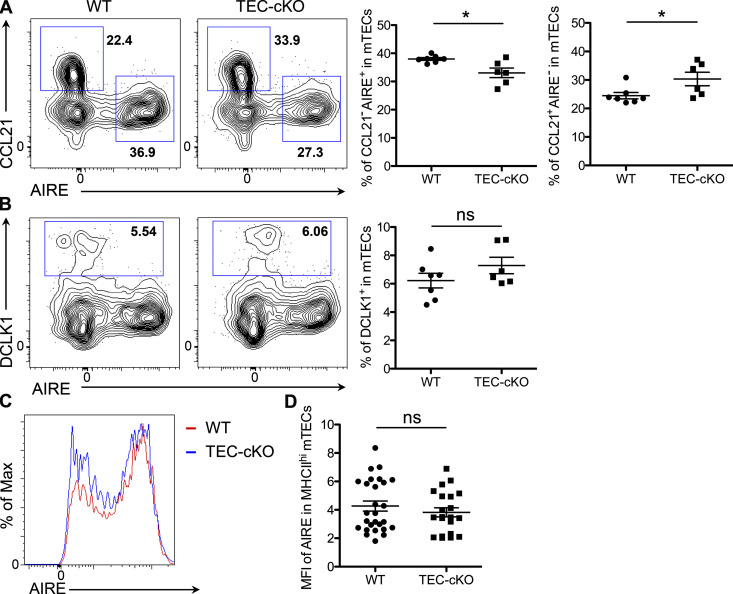
Figure S2.
Effects of miR-155 deficiency on different mTEC subsets. (A and B) FACS analysis and frequencies of CCL21−AIRE+ and CCL21+AIRE− mTECs (A) as well as DCLK1+ tTuft cells (B) from 5–6-wk-old WT and TEC-cKO mice. (C and D) FACS analyses (C) and mean fluorescence intensity (MFI; D) of AIRE in MHCIIhi mature mTECs of TEC-cKO mice compared with WT controls. Each symbol represents an individual mouse, and the bar represents the mean. Data are pooled from at least three independent experiments. Results of Student’s t test: *, P < 0.05; ns, not significant.

