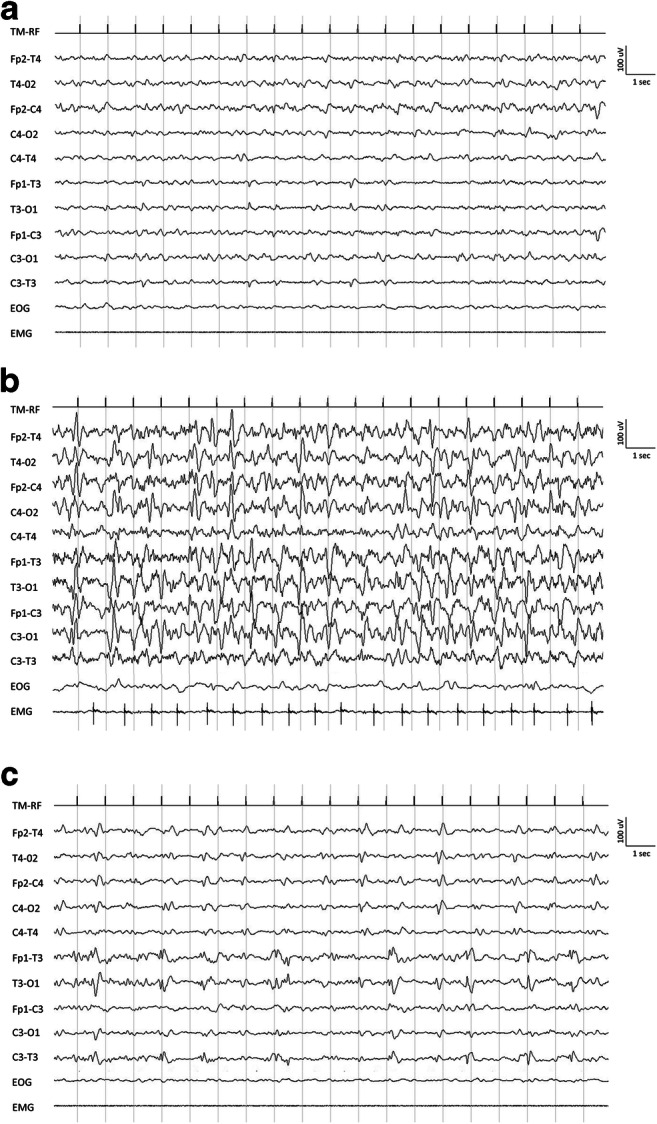
Fig. 2.

Electroencephalogram findings. a EEG performed on day 14 showing a background slowing. b Ictal EEG performed on day 16 showing continuous sharp waves and spike-and-slow-wave complexes at 2–2.5 Hz and 100–150 mV of amplitude with superimposed fast activity predominantly lateralized over the left fronto-centro-temporal regions (lateralized periodic discharges plus superimposed fast activity, LPDs + F pattern). c Interictal EEG performed on day 32 showing low-amplitude spikes and sharp waves predominantly lateralized over the left temporal region
