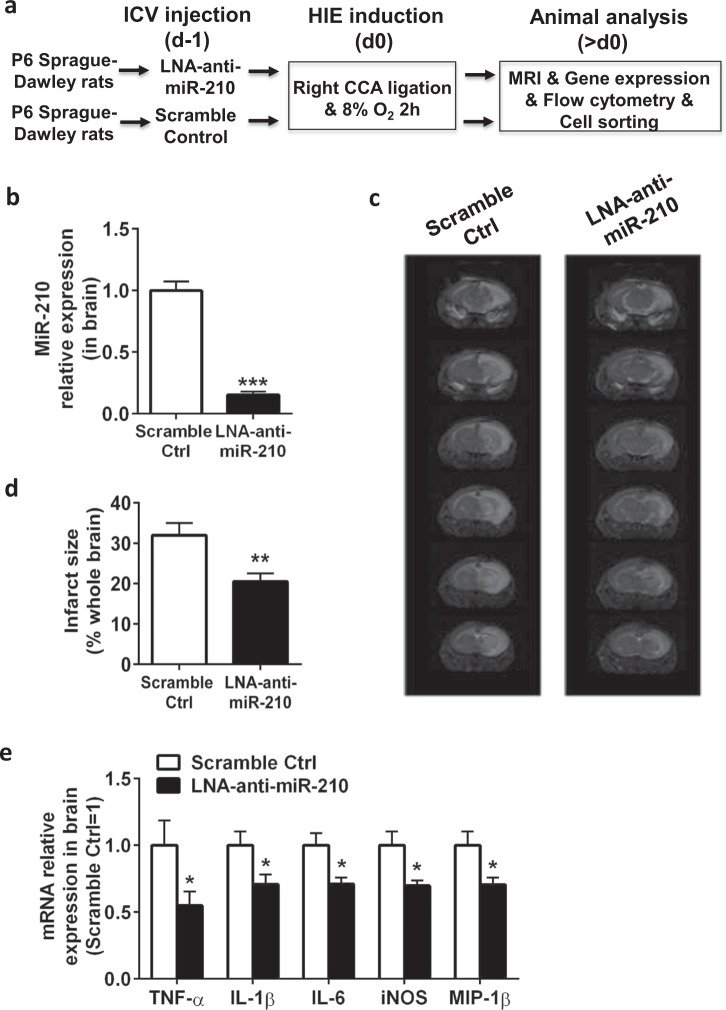
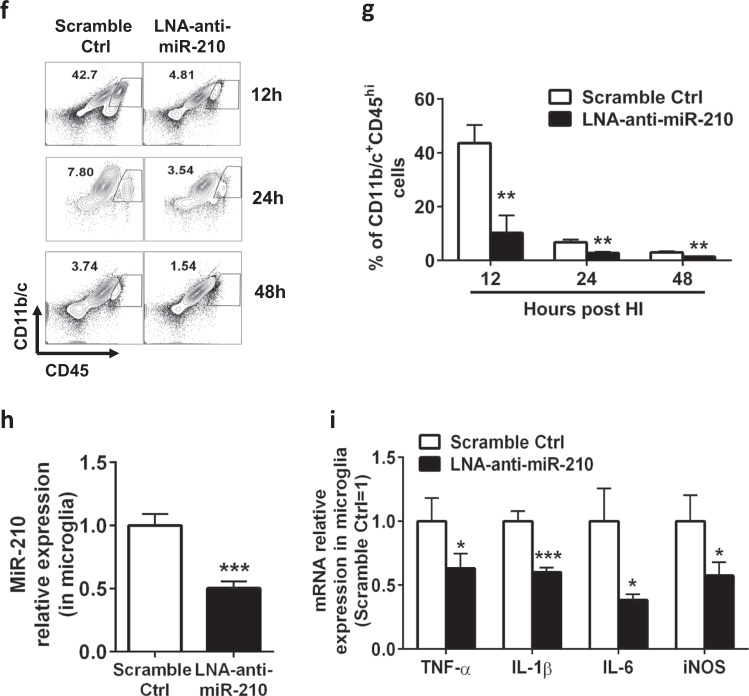
Fig. 2.
Inhibition of miR-210 prevents microglial activation in vivo and suppresses HIE. The experiments were repeated three times. Representative results are presented. a Schematic representation of the experimental design to study the role of miR-210 as an autonomous factor in regulating activated microglia induction of HIE in P7 Sprague-Dawley rat pups. ICV intracerebroventricular, MRI magnetic resonance imaging. b Bar graphs showing the qPCR analysis of global miR-210 expression in the ipsilateral hemisphere of 24 h HIE animals. Data are presented as the mean ± SEM (n = 4–6). c Representative MRI images showing the infarct size of the ipsilateral hemisphere of 48 h HIE animals (n = 6). Note that miR-210 inhibition strongly reduced the infarct size in the right ipsilateral brain (areas in white). d Bar graph showing the quantification of MRI images presented in c. Data are presented as the mean ± SEM (n = 6). e Bar graphs showing the RT-qPCR analysis of proinflammatory molecules in the ipsilateral hemisphere harvested from 12 h HIE animals. Data are presented as the mean ± SEM (n = 6–8). f Representative FACS plots showing the staining for CD11b/c and CD45 in mononuclear cells isolated from the ipsilateral hemisphere of HIE animals at the indicated time points post-HIE induction. g Bar graph showing the quantification of the FACS plots presented in f. Data are presented as the mean ± SEM (n = 6). h Bar graphs showing the qPCR analysis of miR-210 expression in microglia sorted from the ipsilateral hemisphere of 12 h HIE animals. Data are presented as the mean ± SEM (n = 6–8). i Bar graphs showing the RT-qPCR analysis of proinflammatory molecule expression in microglia sorted from the ipsilateral hemisphere of 12 h HIE animals. Data are presented as the mean ± SEM (n = 6–8). *P < 0.05, **P < 0.01, ***P < 0.001


