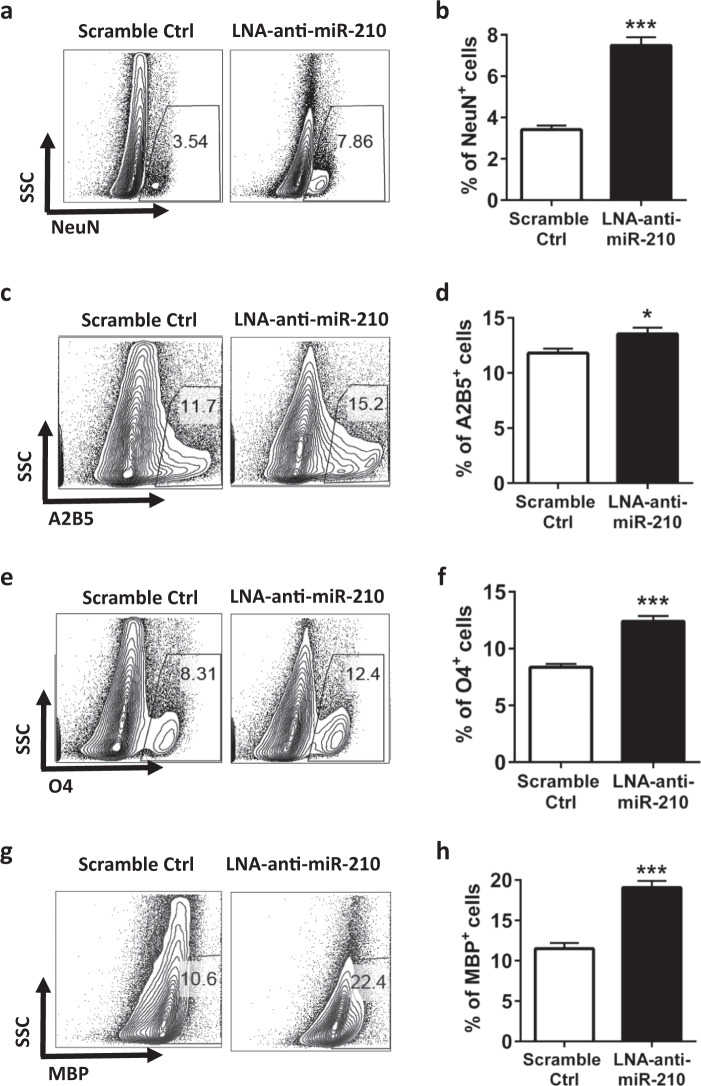
Fig. 3.
Inhibition of miR-210 reduces the loss of neural cells and oligodendrocytes in HIE. The experiments were repeated three times. Representative results are presented. a Representative FACS plots showing the intracellular NeuN staining of mononuclear cells isolated from the ipsilateral hemisphere of scramble control or LNA-anti-miR-210-treated animals at 48 h post-HIE induction. b Bar graph showing the quantification of the FACS plots presented in a. Data are presented as the mean ± SEM (n = 7–8). c Representative FACS plots showing A2B5 staining of mononuclear cells isolated from the ipsilateral hemisphere at 48 h post-HIE induction. d Bar graph showing the quantification of the FACS plots presented in c. Data are presented as the mean ± SEM (n = 7–8). e Representative FACS plots showing the staining for oligodendrocyte O4 in mononuclear cells isolated from the ipsilateral hemisphere at 48 h post-HIE induction. f Bar graph showing the quantification of the FACS plots presented in e. Data are presented as the mean ± SEM (n = 7–8). g Representative FACS plots showing the intracellular MBP staining of mononuclear cells isolated from the ipsilateral hemisphere at 48 h post-HIE induction. h Bar graph showing the quantification of the FACS plots presented in g. Data are presented as the mean ± SEM (n = 7–8). *P < 0.05, ***P < 0.001

