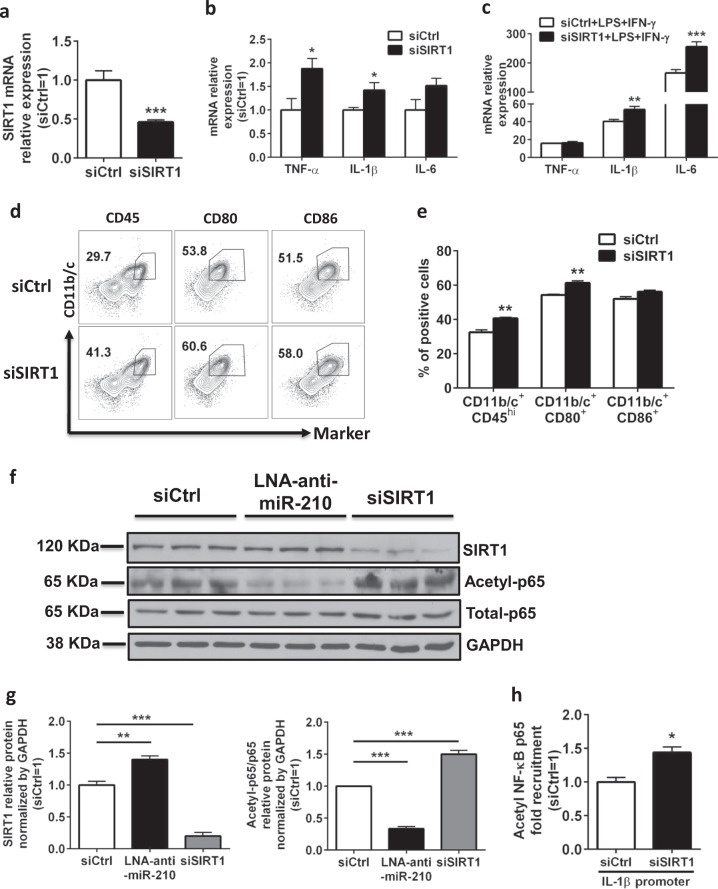
Fig. 6.
SIRT1 is a possible mediator of miR-210 in its regulation of M1 activation in neonatal rat microglia. a, b Neonatal rat primary microglia were treated with nonsilencing control siRNA (siCtrl) or siRNAs specific for rat SIRT1 (siSIRT1) (100 nM) and collected for analysis 24 h post transfection. Bar graph showing the RT-qPCR analysis of the expression of SIRT1 (a) or proinflammatory cytokines (TNF-α, IL-1β, IL-6) (b). Data are presented as the mean ± SEM (n = 6). c–e Neonatal rat microglia were transfected with siCtrl or siSIRT1 (100 nM), recovered overnight (12 h), and then treated with LPS (0.5 ng/ml) and IFN-γ (0.1 ng/ml) for 12 h. Cells were collected for analysis. c Bar graphs showing the RT-qPCR analysis of proinflammatory cytokines (TNF-α, IL-1β, IL-6) in siRNA-transfected microglia. Data are presented as the mean ± SEM (n = 6). d Representative FACS plots showing staining for CD11b/c, CD45, CD80, and CD86 in siRNA-transfected microglia. e Bar graph showing the quantification of the FACS plots presented in d. Data are presented as the mean ± SEM (n = 6). f, g Neonatal rat primary microglia were treated with siCtrl or siSIRT1 or LNA-anti-miR-210 (100 nM) and collected for protein analysis 24 h post transfection. f Western blots showing the analysis of the indicated protein levels in transfected microglia. g Bar graph showing the quantification of the Western blots presented in f. Data are presented as the mean ± SEM of triplicates. h Neonatal rat primary microglia were treated with siCtrl or siSIRT1 (100 nM) and collected for analysis 24 h post transfection. Bar graph showing the ChIP analysis of nuclear binding of acetyl-NF-κB p65 to the IL-1β promoter. Data are presented as the mean ± SEM of triplicates. *P < 0.05, **P < 0.01, ***P < 0.001

