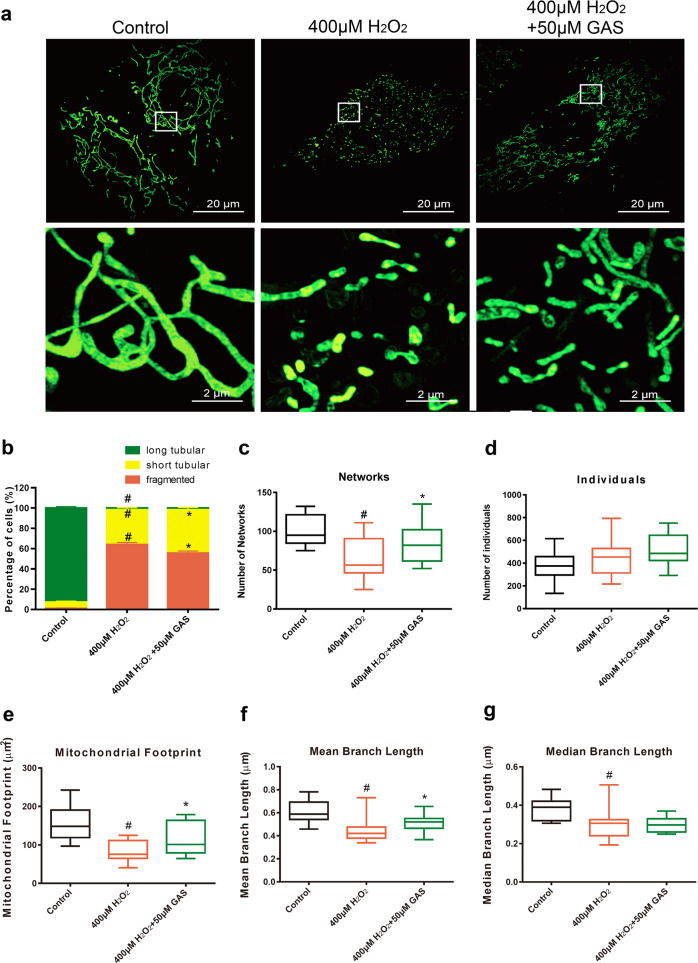
Fig. 3.
GAS attenuated the imbalanced mitochondrial dynamics of H9c2 cells induced by H2O2. a Representative photographs of mitochondrial morphology in H9c2 cells treated with 400 μM H2O2 for 3 h with or without GAS pretreatment. Bar = 20 or 2 µm. b Quantitative results of the percentage of cells with long tubular mitochondria, short tubular mitochondria, or fragmented mitochondria. c–g Quantitative results of mitochondrial network characteristics, including networks (c), individuals (d), mitochondrial footprint (e), mean branch length (f), and median branch length (g). The data presented are the mean ± SD and #P < 0.05 vs. the control group, *P < 0.05 vs. the H2O2-induced group

