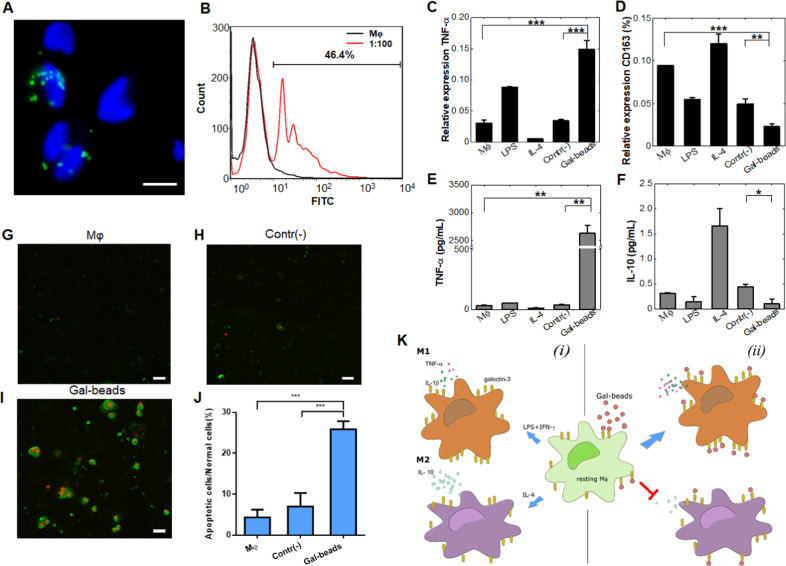
Fig. 1. Galactose docking educated macrophages such that they polarized into a proinflammatory phenotype.
a Analysis of the binding between Gal beads and Mφs by fluorescence image overlay. Gal beads were labeled with FITC, and the Mφs were stained with DAPI; scale bar = 20 μm. b FACS analysis results of the binding between naïve Mφs and Gal beads. The Gal beads coated with Mφ were gated. c–f Results from the quantitative analysis of M1 and M2 phenotype markers. The induced expression of transcript levels of IL-1β (c, an M1 phenotype marker) and CD163 (d, an M2 phenotype marker) as related to the internal GAPDH control. The induced secretion levels of proinflammatory e and anti-inflammatory f cytokines. The values represent the means ± SD of three individual experiments. g–i Combining Gal beads and Mφs leads to cancer cell apoptosis. Mφ itself g or with either bare beads h or Gal beads i were placed in the upper chamber, and the cancer cells were placed in the lower chamber. Cancer cells in the lower chamber were stained with Annexin V (green) and propidium iodide (red) to determine cell apoptosis. Scale bar = 50 μm for g–i. j Quantitative data indicating the number of apoptotic cells to normal cells. The cell counts in each experiment were obtained from 10 to 15 fields of view using a fluorescence microscope. The values represent the means ± SD of three individual experiments. k Schematic diagram illustrating Mφ polarization influenced by the cellular microenvironment in this study. Under standard conditions, resting Mφs can polarize to either the M1 or M2 phenotype upon exposure to the stimulating molecules LPS/IFN-γ or IL-4 (panel i). In a galactose-rich environment, the resting Mφs polarize to the M1 phenotype while the M2 type is inhibited (panel (ii)). The asterisks indicate significance, and the p values were calculated with Student’s t-test (*p < 0.05; **p < 0.01; and ***p < 0.001).

