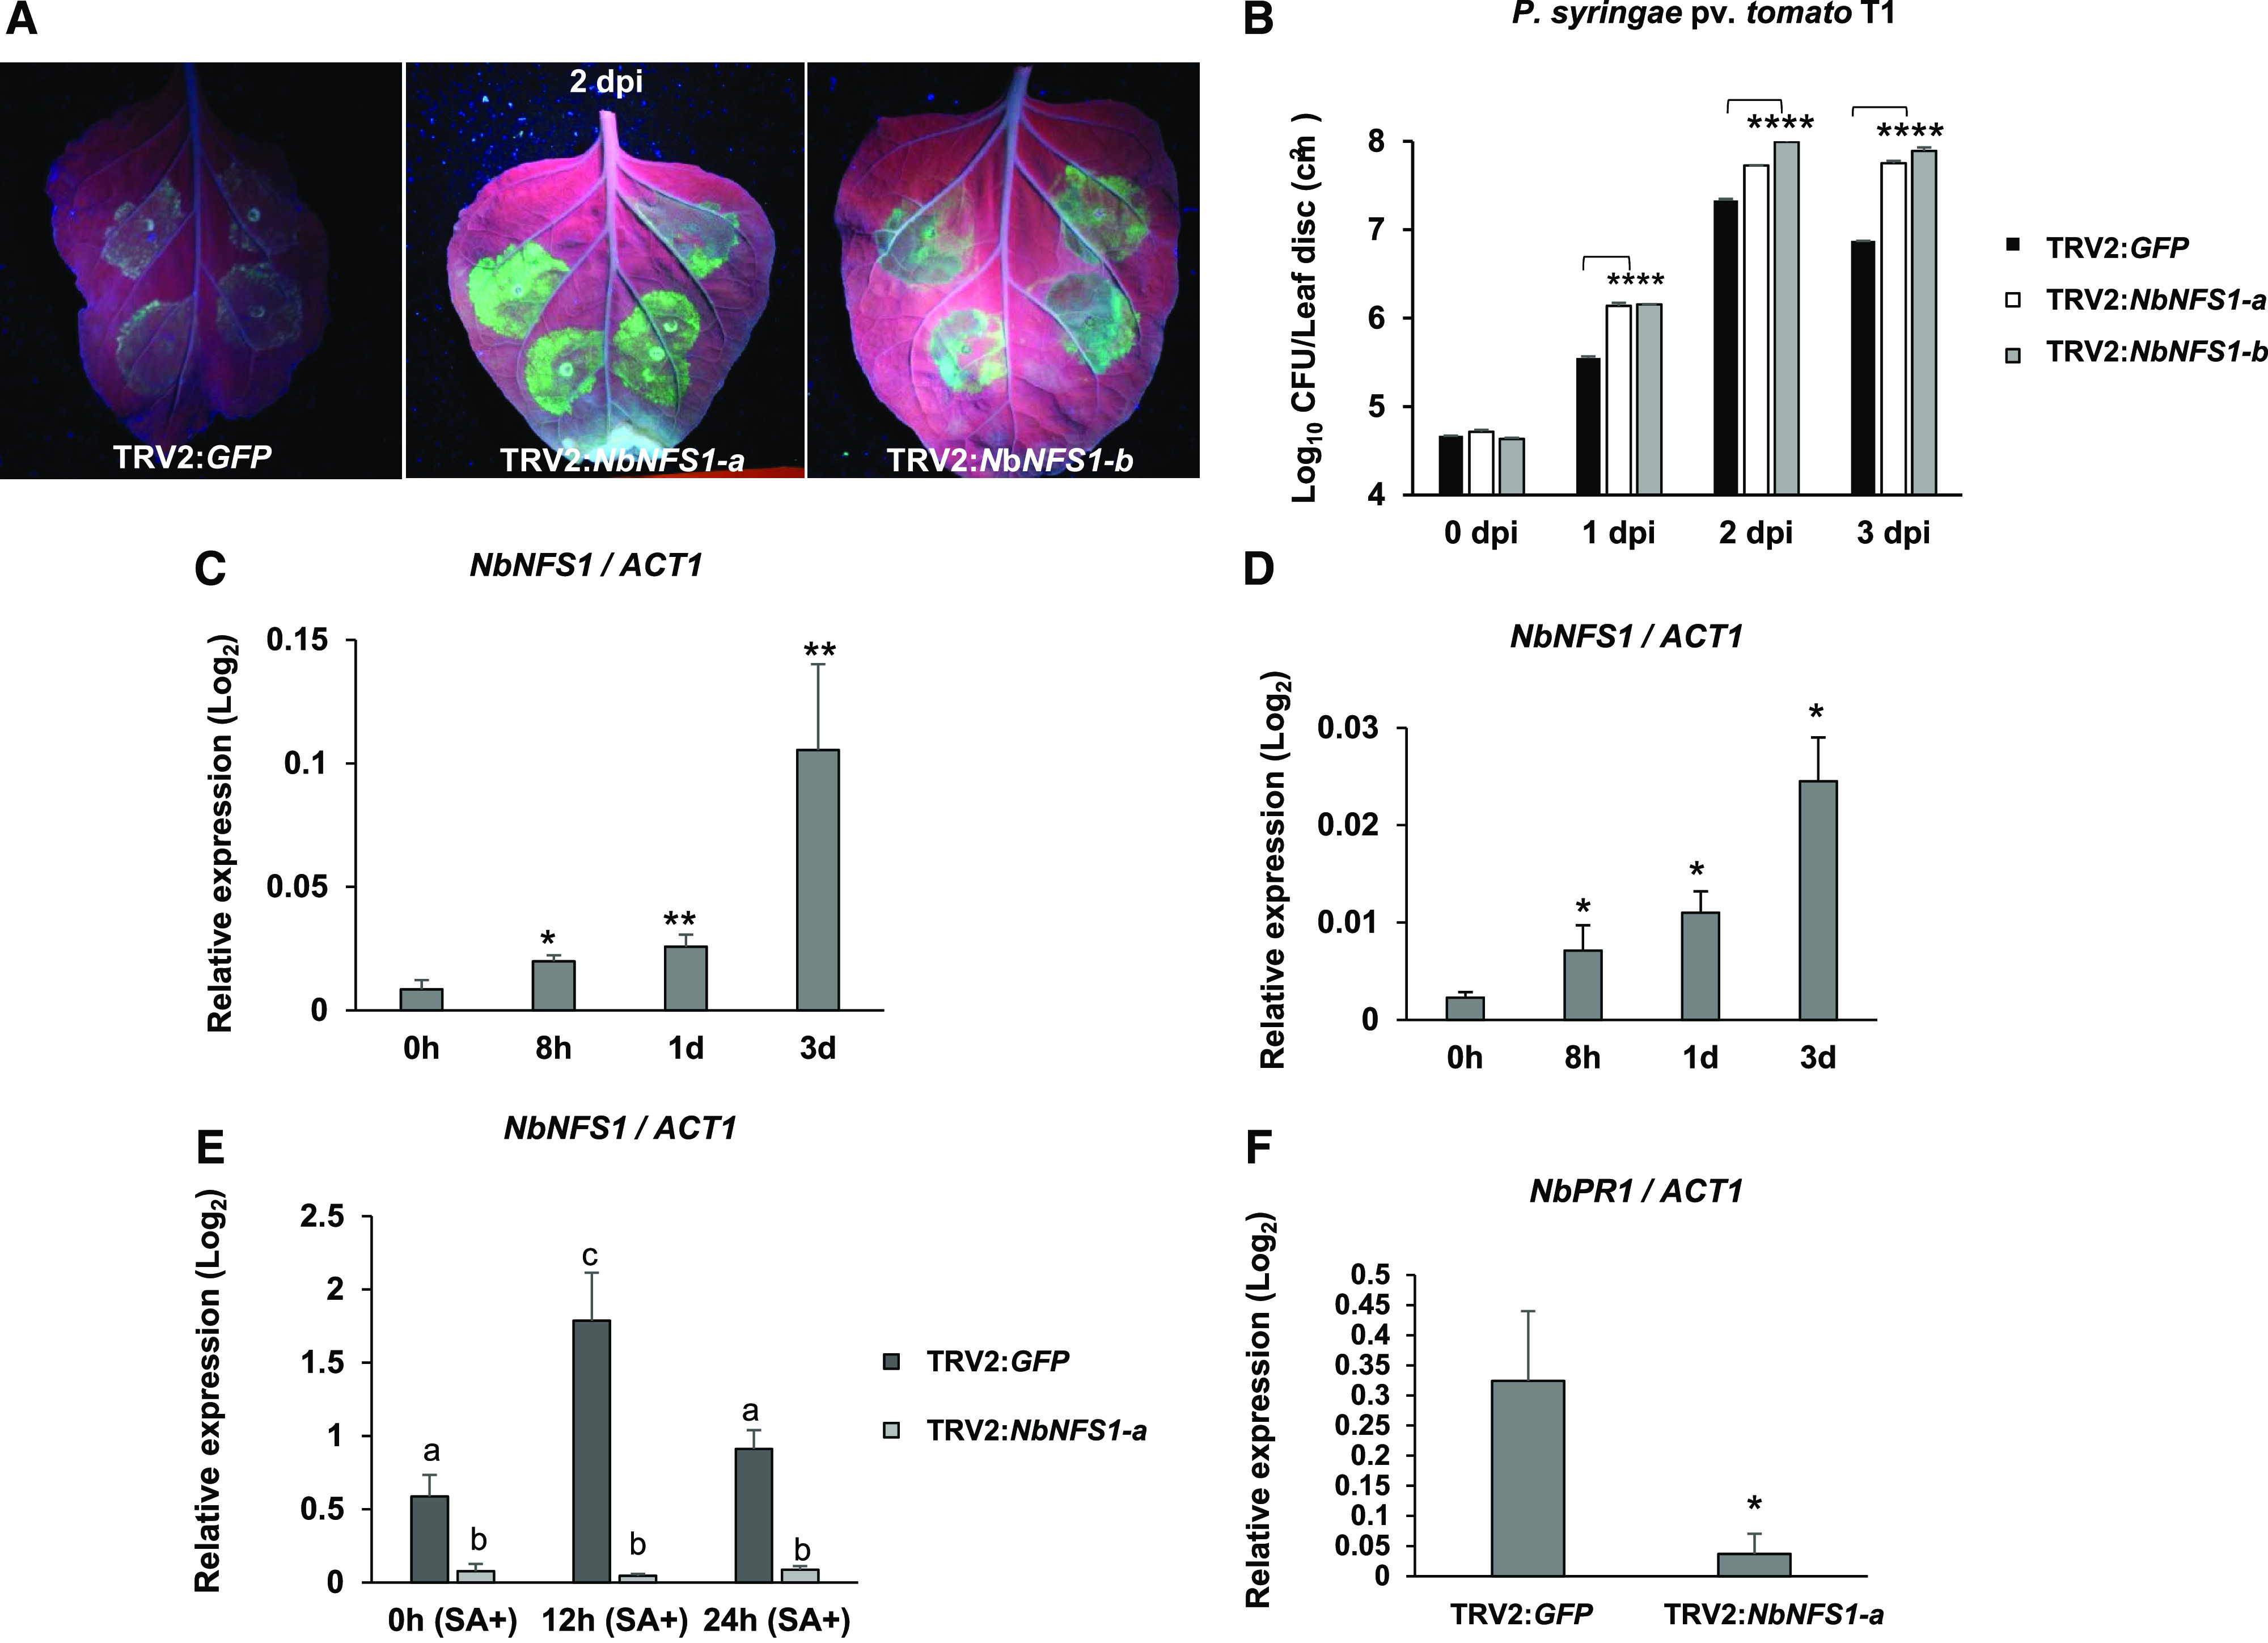
Figure 1.

NbNFS1-silenced plants are more susceptible to infection by the nonhost pathogen P. syringae pv. tomato T1 than the control. A, GFPuv-labeled P. syringae pv. tomato T1 accumulation in TRV2:NFS1-a and TRV2:NFS1-b leaves compared to the unsilenced control TRV2:GFP leaf under UV light. A needleless syringe was used to infiltrate the abaxial side of leaves from 6-week-old N. benthamiana plants with P. syringae pv. tomato T1 suspension at 8 × 10⁵ CFU mL−1. Photographs were taken 2 d after infection. B, Quantification of nonhost pathogen multiplication demonstrates a significant increase in bacterial multiplication for NbNFS1-a- and NbNFS1-b-silenced N. benthamiana plants compared to the control. The abaxial side of 6-week-old N. benthamiana leaves was infiltrated with a needleless syringe containing bacterial solution at 8 × 10⁵ CFU/mL−1. The infiltrated region of the leaves was collected at various time points for bacterial quantification. Histograms represent means of four biological replicates. Error bars indicate se. Asterisks indicate significant differences according to one-way ANOVA (****P < 0.0001). All experiments were repeated two times with similar results. C and D, Relative expression of NbNFS1 by RT-qPCR in wild-type N. benthamiana in response to infection by the nonhost bacterial pathogen P. syringae pv. tomato T1 (C) or the host pathogen P. syringae pv. tabaci (D). Three-week-old N. benthamiana plants were sprayed with a bacterial suspension of P. syringae pv. tomato T1 at 8 × 10⁵ CFU mL−1 or P. syringae pv. tabaci at 1.6 × 10⁵ CFU mL−1. Leaf samples were collected at 8 h, 1 d, and 3 d after infection; total RNA was isolated and subjected to RT-qPCR. The expression level was normalized to the ACT1 gene. Histograms represent means of three biological replicates. Error bars represent se. Asterisks represent statistical significance according to Student’s t test (*P < 0.05 and **P < 0.01). All experiments were repeated two times with similar results. E, NbNFS1 expression in NbNFS1-silenced N. benthamiana in response to SA. Six-week–old plants of NbNFS1-silenced (TRV:NbNFS1-a) and control (TRV:GFP) plants were sprayed with 1 mm of SA and leaf samples were collected at various time points after treatment. Total RNA was isolated and subjected to RT-qPCR. The expression level was normalized to the ACT1 gene. Histograms represent means of three biological replicates. Error bars represent se. Lowercase letters represent statistically significant differences according to one-way ANOVA (P value < 0.05). All experiments were repeated two times with similar results. F, NbPR1 expression by RT-qPCR in NbNFS1-silenced N. benthamiana. Total RNA was isolated from 6-week–old NbNFS1-silenced N. benthamiana and nonsilenced control (TRV2:GFP) plants. Histograms represent means of four biological replicates. The expression level was normalized to the ACT1 gene. Error bars represent se. Asterisk represents statistical significance according to Student’s t test (*P < 0.05). All experiments were repeated two times with similar results.
