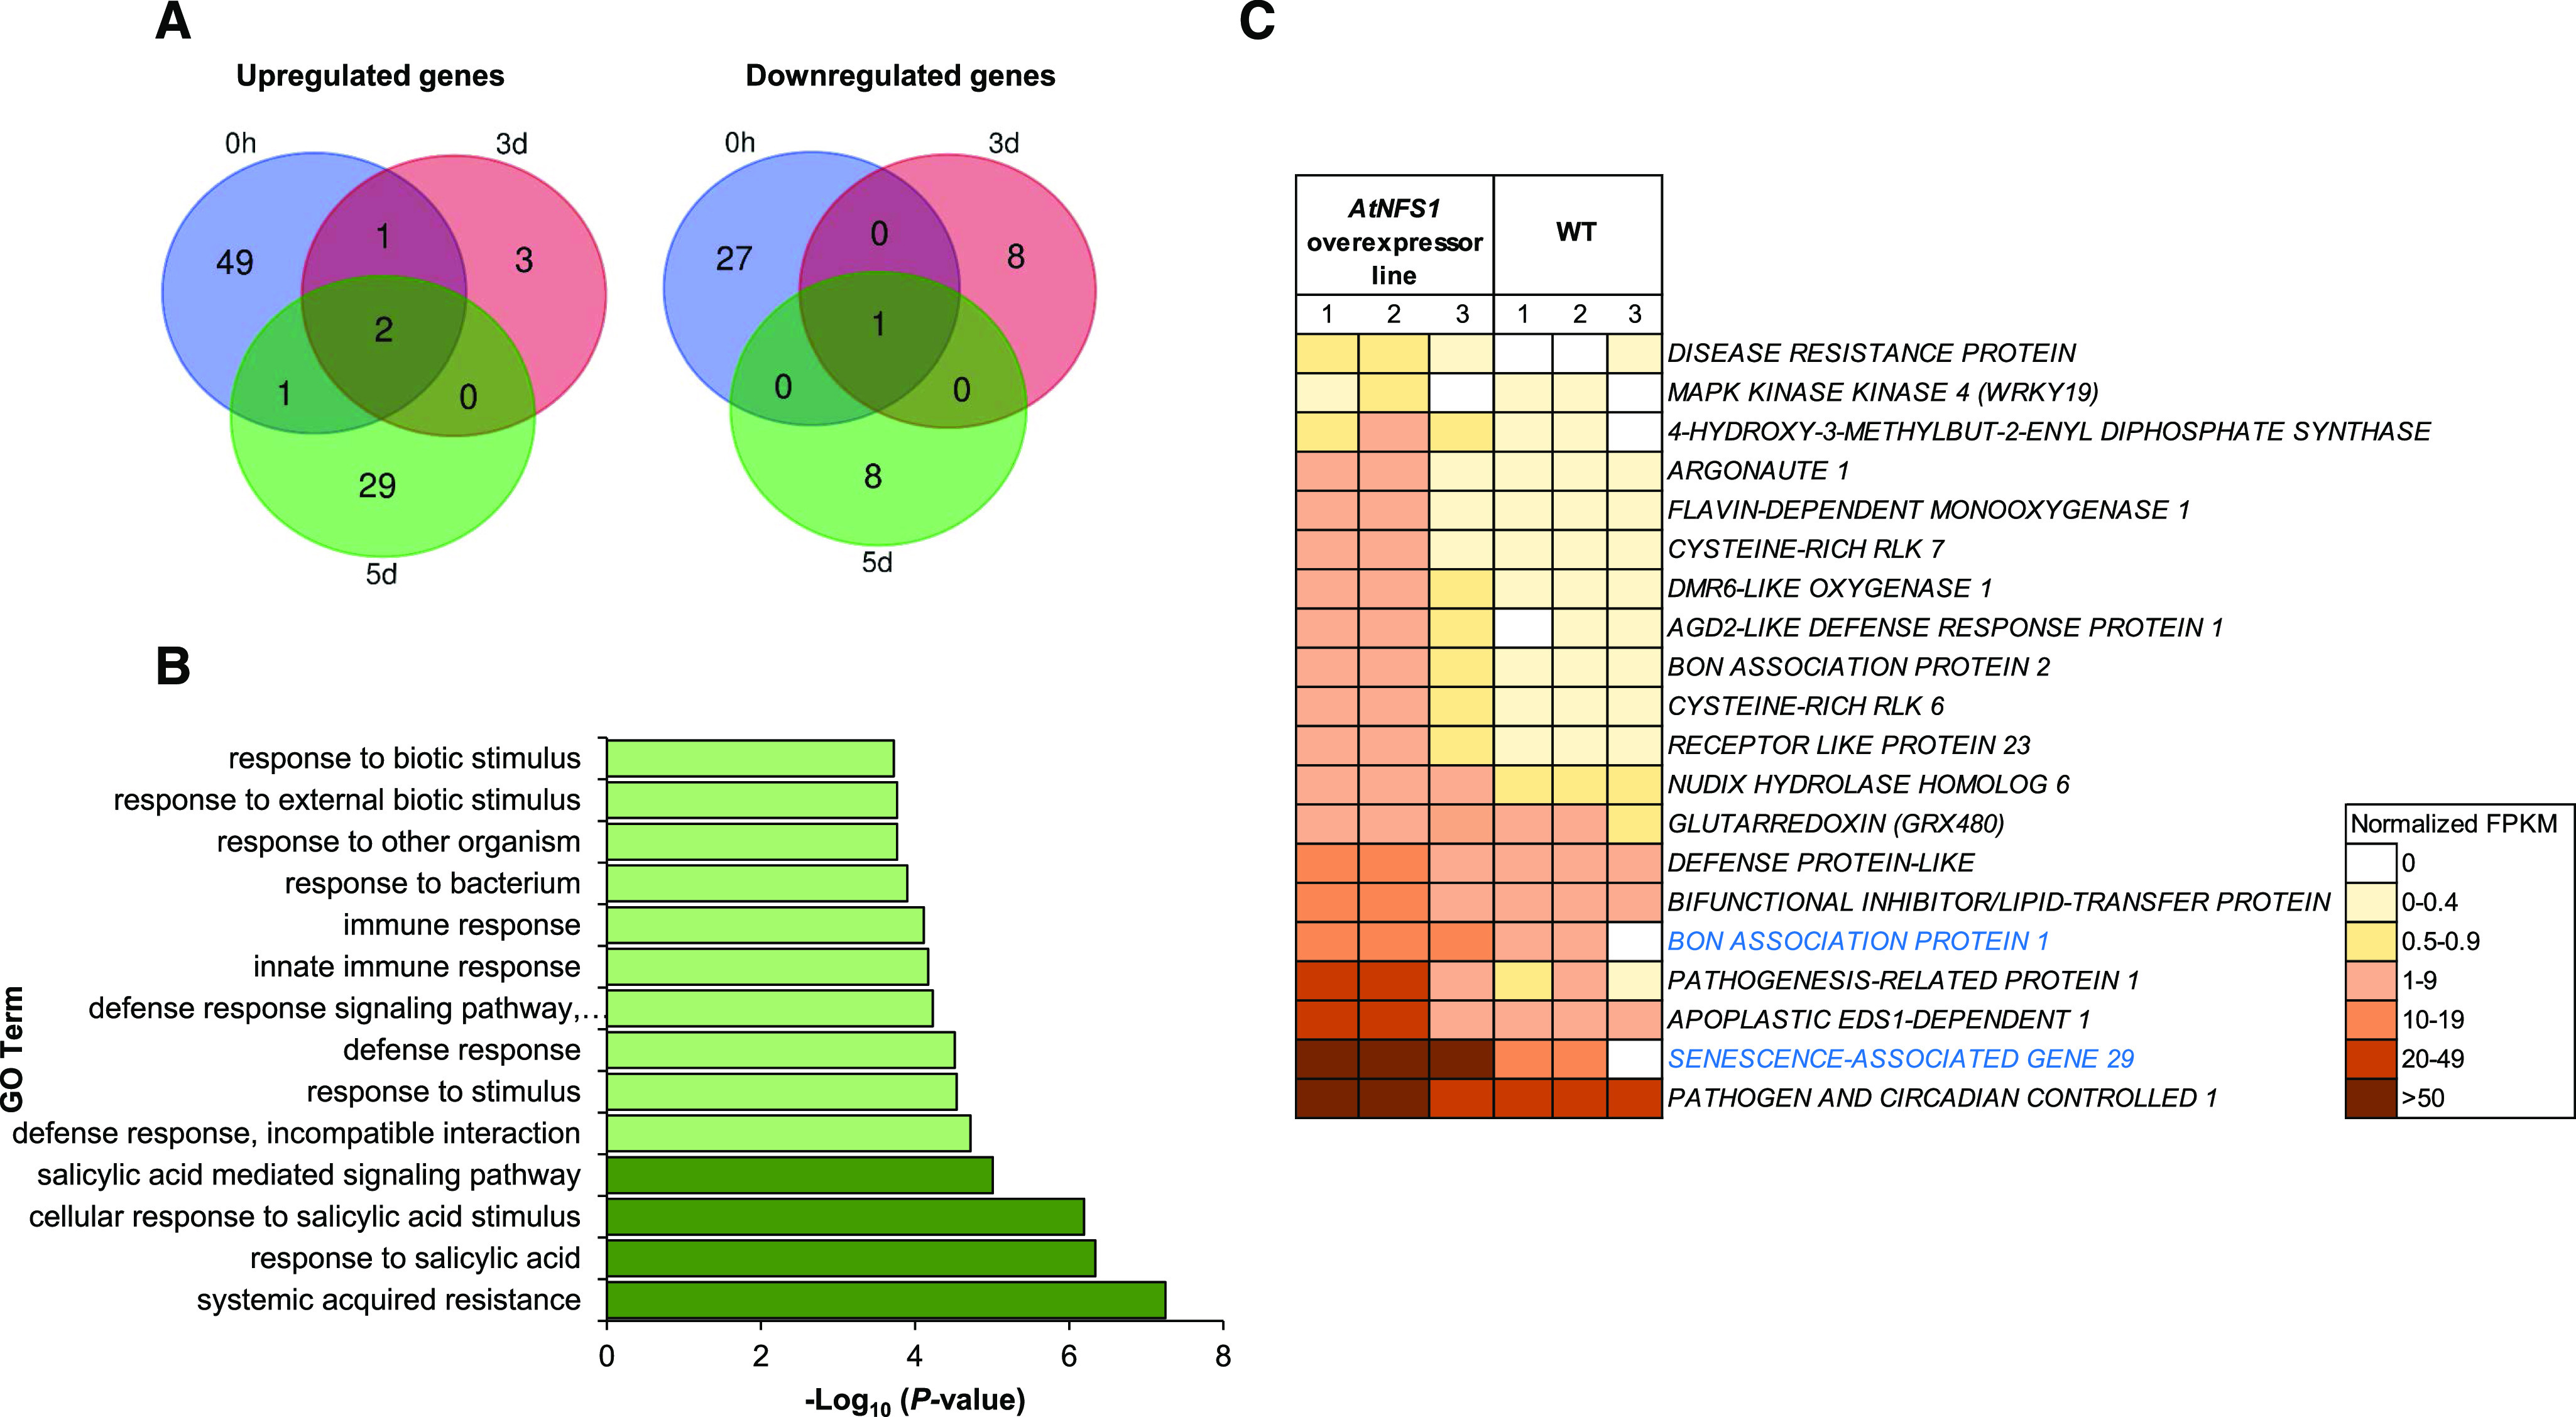
Figure 8.

RNA-seq analysis showing upregulation of defense- and SA-responsive genes between the NFS1 overexpressor line and wild-type (WT) plants upon P. syringae pv. tomato DC3000 infection. A, The aerial part (leaf and stem) of 5-week-old Arabidopsis seedlings was collected from three plants (n = 3) for two genotypes (wild type and NFS1.2-18-OX), at different time points (0, 3, and 5 d) upon flood-inoculation with the host pathogen P. syringae pv. tomato DC3000 (1.6 × 10⁵ CFU mL−1). RNA was isolated from the samples and subjected to RNA-seq. The Venn diagram depicts DEGs (Log2 fold change > 1, < −1; FDR < 0.05) identified between a NFS1 overexpressor line and the wild type for each time point. B, GO enrichment analysis of DEGs from RNA-seq data. The bar chart shows all the significantly enriched defense-related GO terms in the NFS1 overexpressor line compared to wild-type plants with the P-value cutoff as 0.05. SA-related GO terms appear in dark green. C, Heatmap showing raw, normalized FPKM values from upregulated defense-related genes identified in the AtNFS1 overexpressor line in relation to the wild type. Heatmap of 20 upregulated genes color-coded from white to brown according to increasing FPKM values. Eighteen defense-related genes belong to the 0-h time point (gene names shown in black) while only two genes belong to the 5-d time point (gene names highlighted in blue). The color legend represents raw FPKM-normalized values.
