
Figure 2.
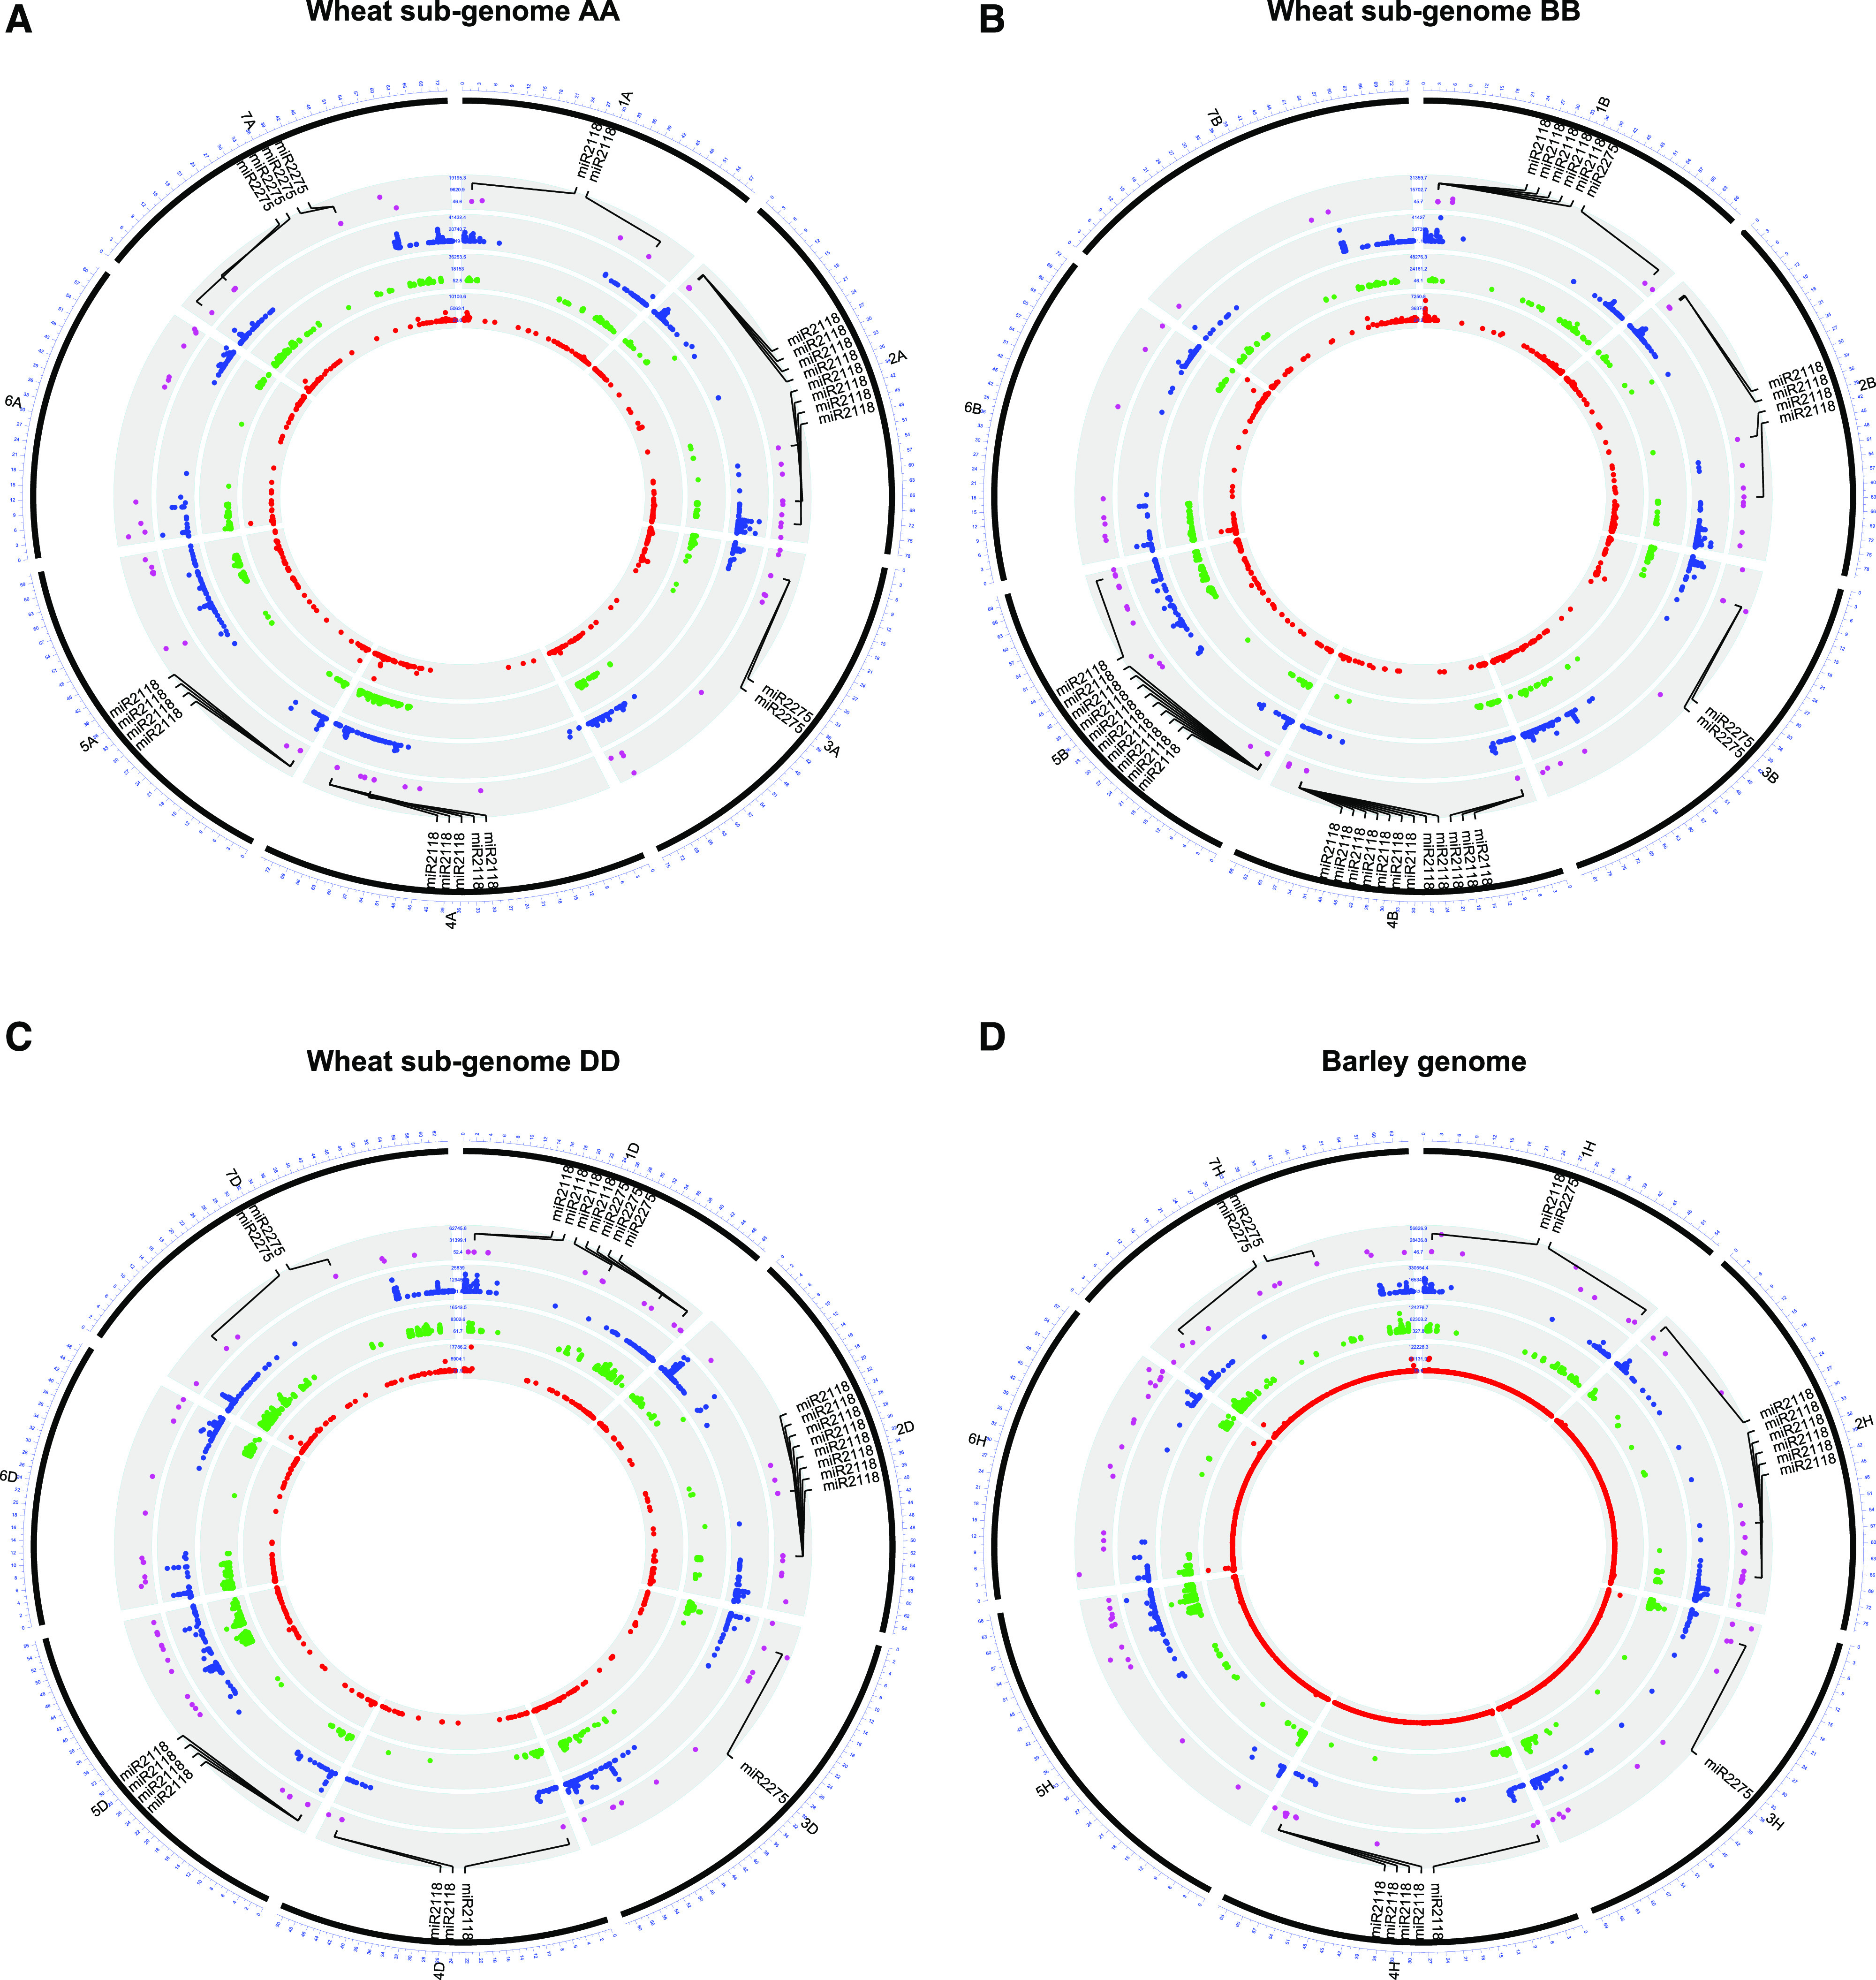
Circular plot showing the distribution and abundance of heterochromatic siRNAs (red), 21-nt (green), and 24-nt (blue) phasiRNAs as well as miRNAs (purple) annotated in wheat subgenomes A (A), B (B), and D (C) and in barley (D) genomes. The genomic distribution of miRNA triggers for 21-PHAS (miR2118) and 24-PHAS (miR2275) transcript cleavage are labeled. Normalized in reads per million mapped, the total abundance includes all sequencing libraries (21 total) covering seven stages of development in three replicates each.