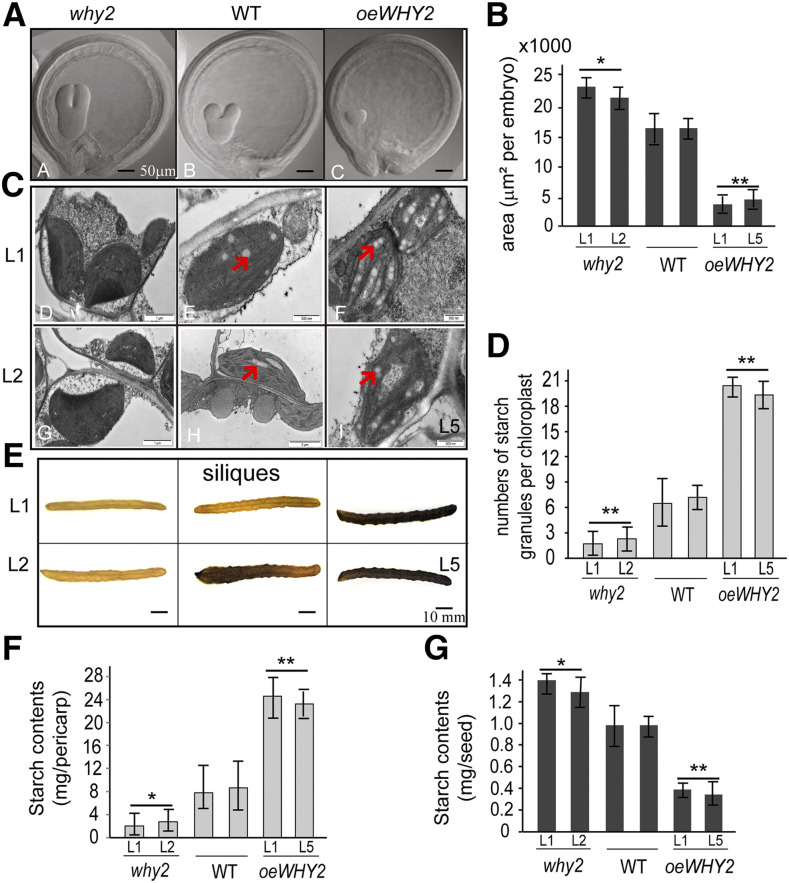
Figure 2.
Cytological and histochemical analysis of siliques of oeWHY2, why2, and wild-type (WT) plants. A, Representative images of developing embryo in the seeds (7-week-old plant) are shown above the panels. Scale bars = 50 μm (as shown in the top left). B, Calculation of the embryo size in the silique of oeWHY2, why2, and wild-type plants. Twenty embryos per line were used. C, Observation of chloroplast ultrastructure. The red arrows indicate the starch granules. Scale bars = 250 nm. D, Calculation of the starch granules in the pericarp cells of oeWHY2, why2, and wild-type plants. Ten cells/silique and 5 chloroplasts/cell were used. Error bars represent the sd of triplicates. E, Starch staining of siliques including pericarp and seed in 9-week-old oeWHY2, why2, and wild-type plants. The red arrows indicate the seeds. Scale bars =10 mm. The siliques were separated to pericarp and seed to digitally extract for comparison. F and G, Starch content of siliques including pericarp (F) and seed (G) in 9-week-old oeWHY2, why2, and wild-type plants. Three plants, three siliques/plant, and 30 seeds/silique were used. Error bars represent the sd of triplicate reactions. Asterisks denote statistically significant differences from the wild type, calculated using Student’s t test: *P < 0.05; **P < 0.01; and ***P < 0.001.

