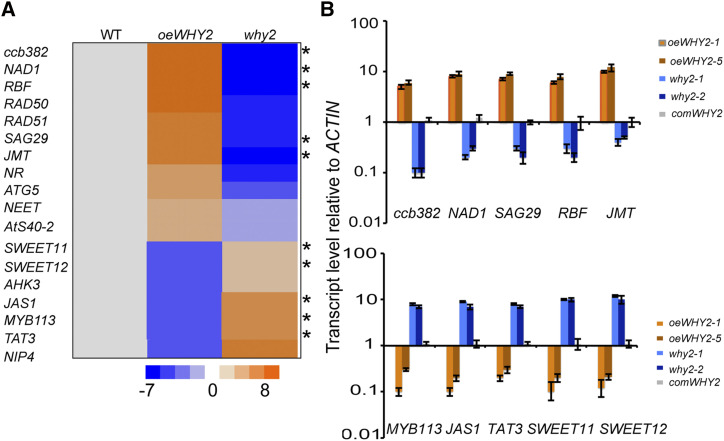
Figure 3.
The expression profile of select genes in the rosette leaf of oeWHY2, why2, and wild-type (WT) plants. A, heatmap showing the changes in expression of select genes (see Supplemental Fig. S4) in oeWHY2, why2, and wild type by RT-qPCR analysis. B, Confirmation of the expression of select genes in the two oeWHY2, two why2, and two comWHY2 lines, compared with wild type by RT-qPCR analysis. Error bars represent the sd of three biological replicates.

