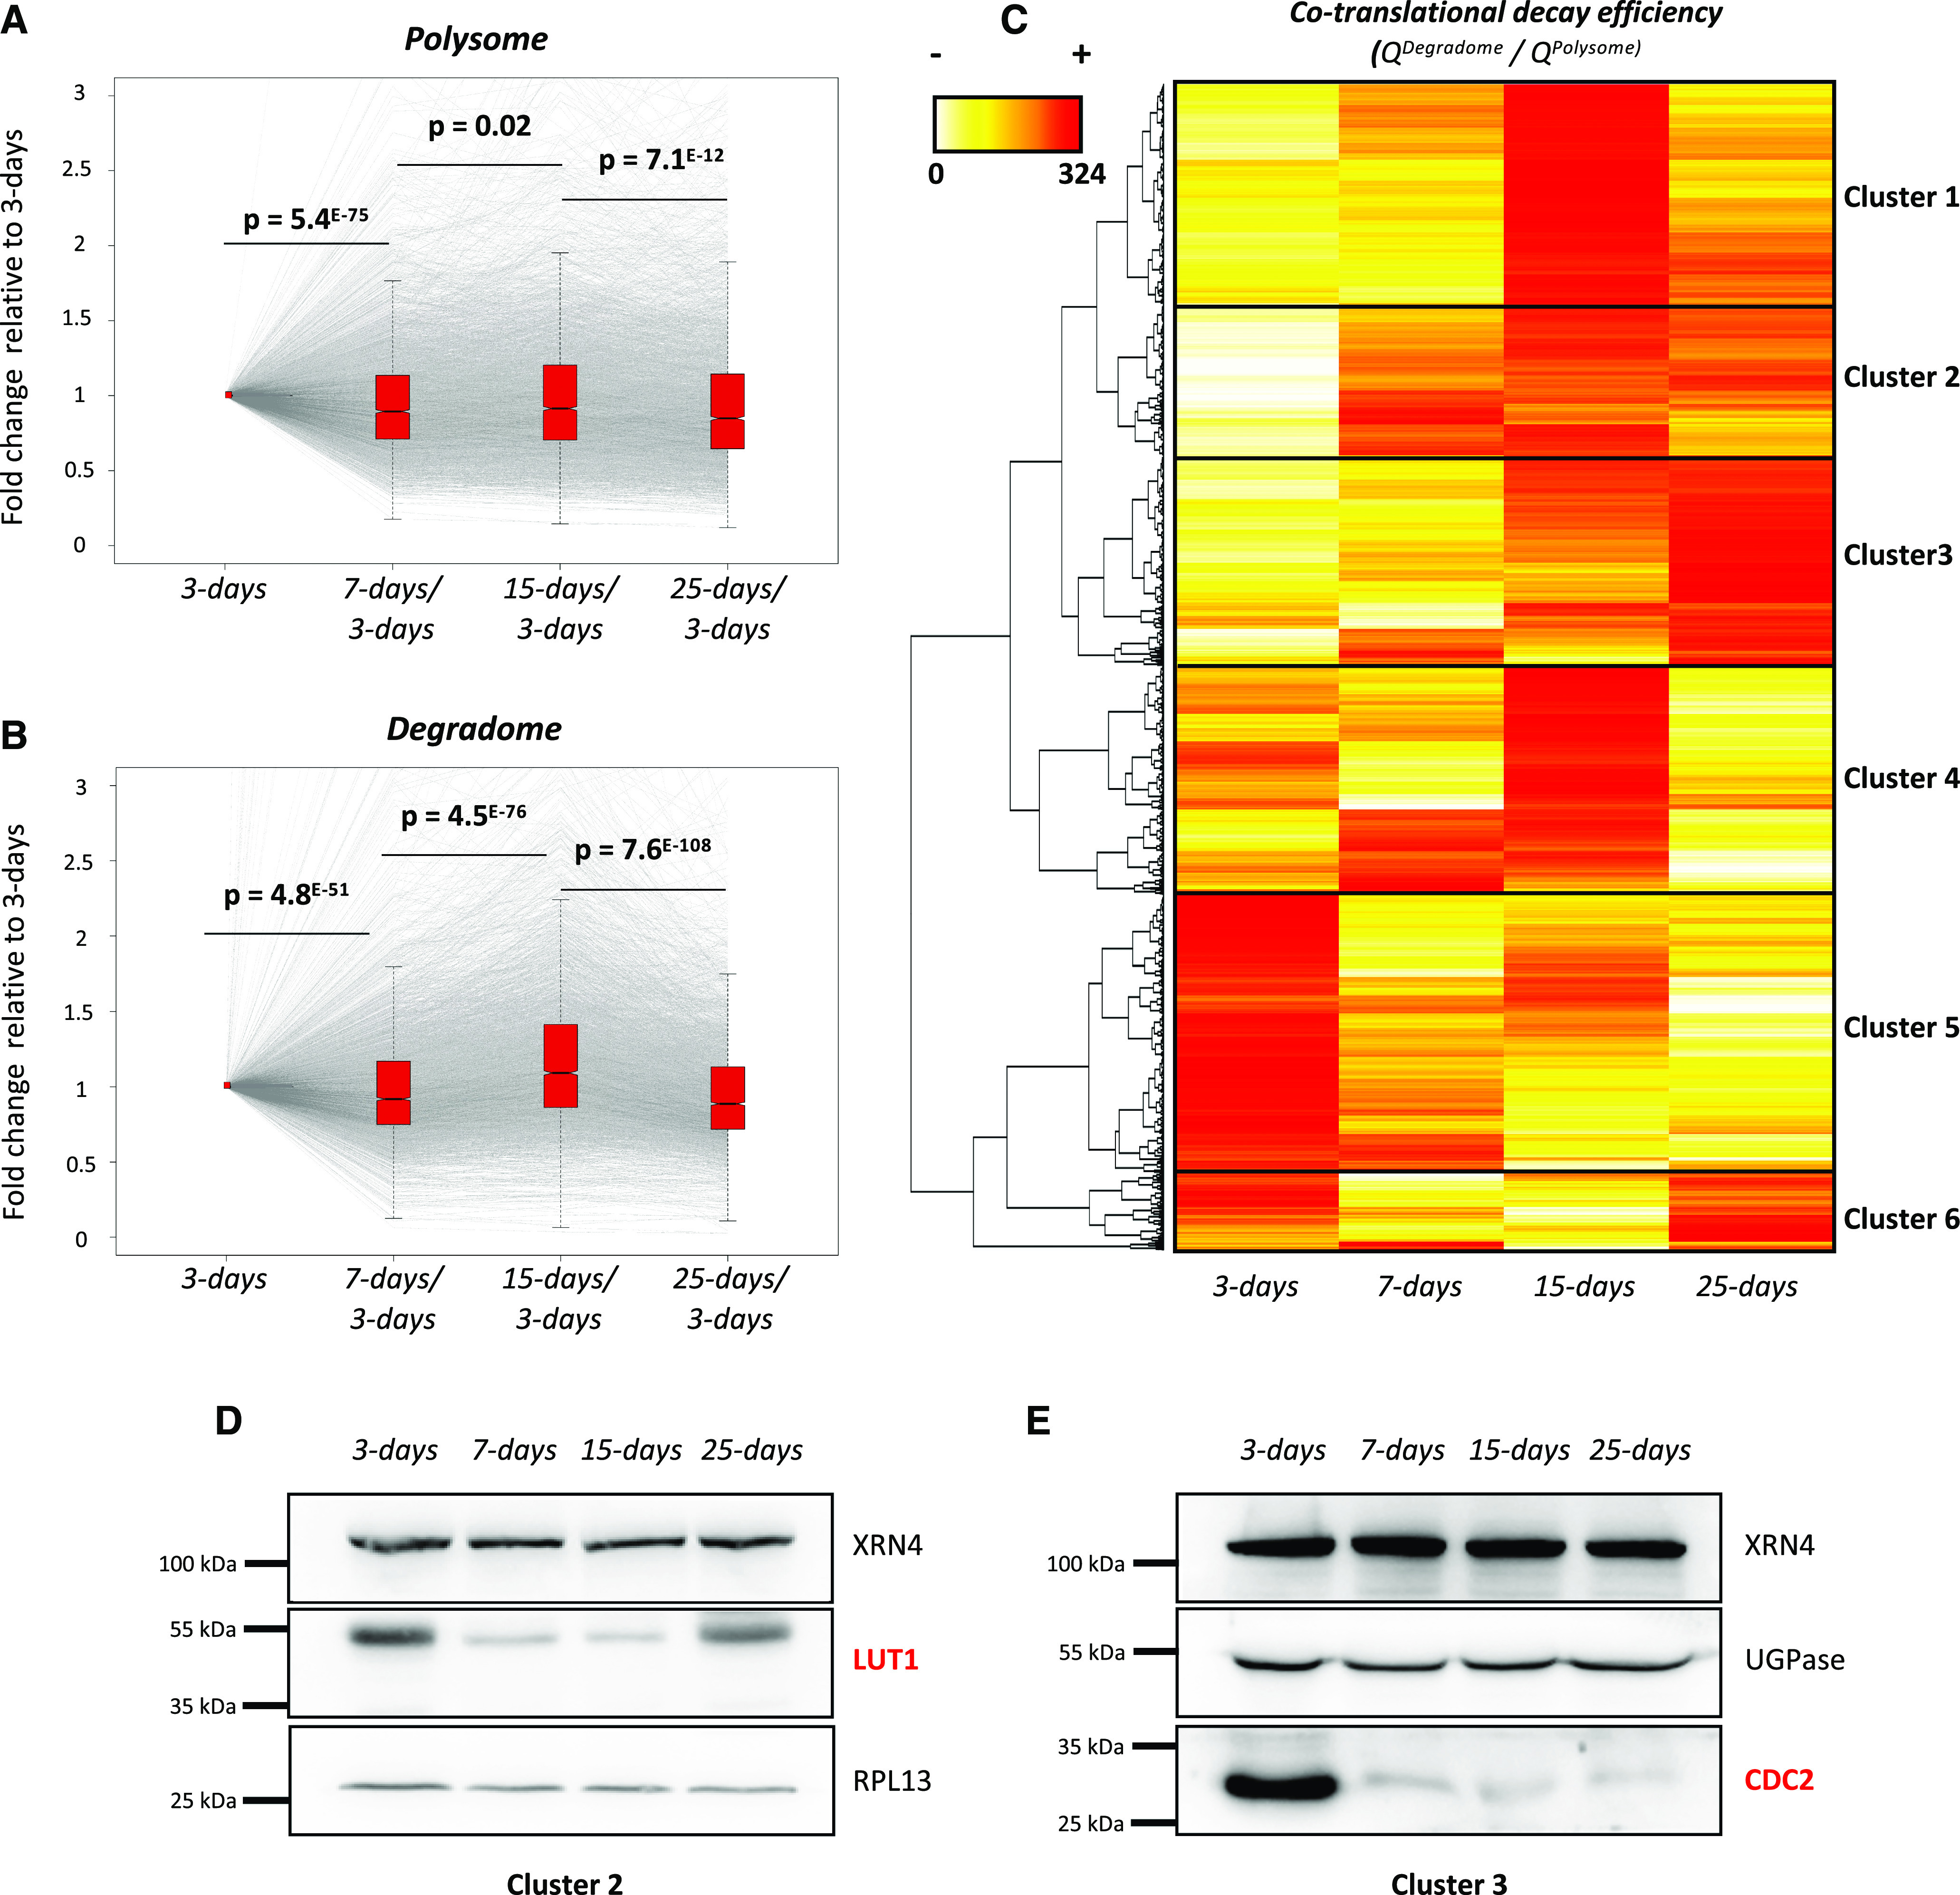
Figure 5.

Cotranslational decay is regulated during development and influences protein production. A, Transcript variation at the polysome level during development using 3-d samples as a reference (n = 3,366). B, Transcript variation at the degradome level during development using 3-d samples as a reference (n = 3,366). Gray lines represent individual transcript variation. Transcript distribution is represented by notched box plots, and significance was assessed by P values (nonparametric Wilcoxon test). C, Heat map of cotranslational decay efficiency (ratio in degradome data over polysome RNA-seq data; n = 3,366). Red values correspond to high decay efficiency and yellow values to low decay efficiency. D and E, Immunoblots using LUT1 (D) and CDC2 (E) antibodies. Both candidates were analyzed on distinct SDS-PAGE gels (8% and 10% acrylamide, respectively). RPL13 and UGPase antibodies were used as loading controls. Each immunoblot was performed as two biological replicates.
