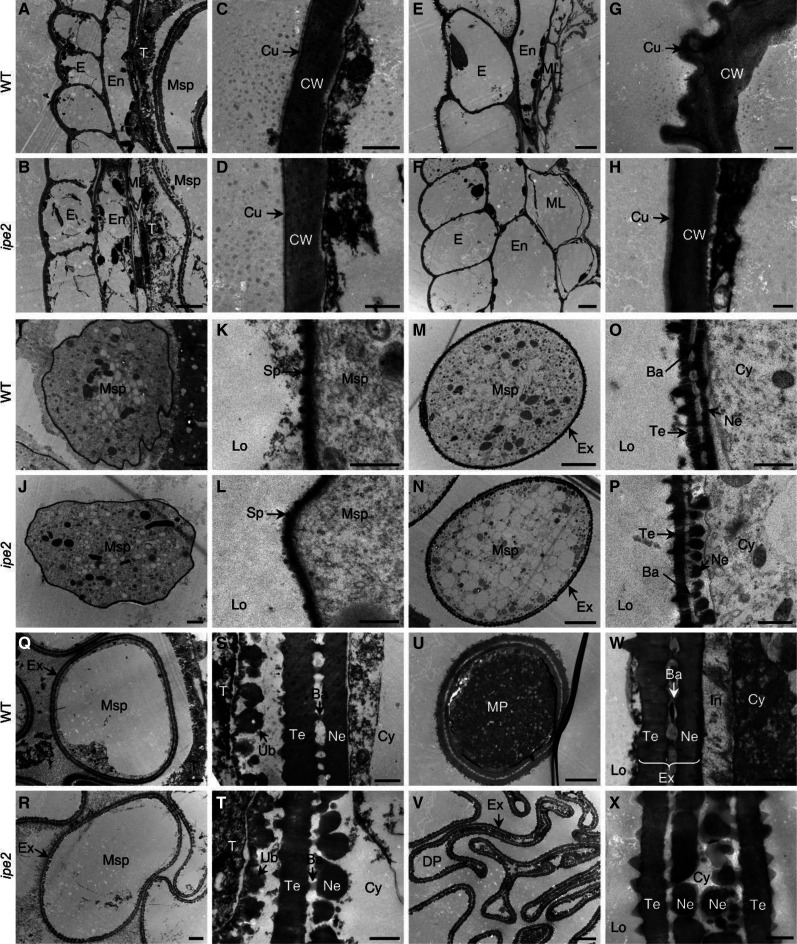
Figure 3.
TEM analysis of wild-type (WT) and ipe2 anthers. A and B, Anther wall of wild type (A) and ipe2 (B) at large vacuole stage. E and F, Anther wall of wild type (E) and ipe2 (F) at mature pollen stage. I and J, Microspores of wild type (I) and ipe2 (J) at early uninucleate stage. M and N, Microspores of wild type (M) and ipe2 (N) at microspore release stage. Q and R, Microspores of wild type (Q) and ipe2 (R) at large vacuole stage. U and V, Mature pollen grains of wild type (U) and ipe2 (V). In C, D, G, H, K, L, O, P, S, T, W, and X, are the close-up views of identical-stage tissues in A, B, E, F, I, J, M, N, Q, R, U, and V, respectively. Ba, Bacula; Cu, cuticle; CW, cell wall; Cy, cytoplasm; DP, defective pollen; E, epidermis; En, endothecium; Ex, exine; In, intine; Lo, locule; ML, middle layer; MP, mature pollen; MSp, microspore; Ne, nexine; Sp, sporopollenin; T, tapetum; Te, tectum; Ub, ubisch body. Scale bars = 5 μm (A, B, E, F, M, N, Q, R, U, and V), 2 μm (I and J), and 500 nm (C, D, G, H, K, L, O, P, S, T, W, and X).

