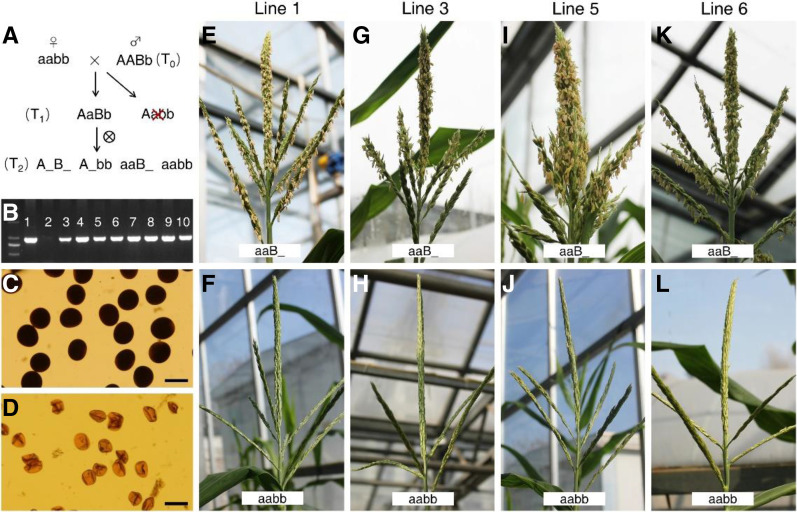
Figure 5.
Genetic complementation of IPE2. A, Flow chart of genetic complementation of IPE2. A/a, Alleles of IPE2/ipe2 in the innate locus; B/b, alleles of IPE2/ipe2 in the transgenic insertion site. AaBb individuals from T1 generation were selected for self-crossing. B, PCR detection of T0 transgenic lines. Lane 1 is a positive control, lane 2 is a negative control, and lanes 3 to 10 are positive lines. C, Pollen grains from positive lines with “aaB_” genotype are stained with 1% I2-KI solution. D, Pollen grains from negative lines with “aabb” genotype are stained with 1% I2-KI solution. Scale bars = 100 μm. E, G, I, and K, Positive transgenic plants with “aaB_” genotype from T2 individuals of the four events. F, H, J, and L, Negative transgenic plants with “aabb” genotype from T2 individuals of the four events.

