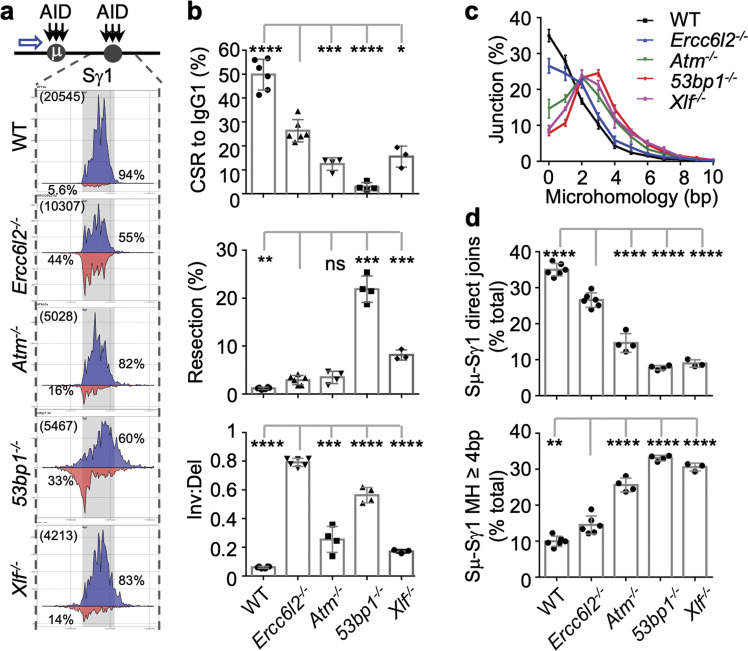
Fig. 6. ERCC6L2 determines orientation-specific recombination.
a Distribution of S junctions in CSR-activated B cells. Top, AID targeting (black arrow) in Sμ and Sγ1, and HTGTS bait site (blue arrow) are depicted. Bottom, linear distribution of pooled junctions along Sγ1 and flanking regions recovered from LPS/IL4-stimulated B cells. Gray boxes indicate Sγ1. Blue, junctions orientated from left to right; Red, Junctions orientated from right to left. Total Sμ–Sγ1 junction number (bracketed) and percentages of inversional/deletional junctions in the region are labeled. b CSR to IgG1, percentage of resection, and inversional/deletional joining ratio are plotted from top to bottom for the indicated B cells. Data were from 3 to 6 mice. c Microhomology usage of Sμ–Sγ1 DNA rearrangement junctions in the indicated activated B cells. Percentage of junctions with different length of microhomology are plotted. d Percentages of direct joins of 5′ Sμ to Sγ1 (upper panel) and percentage of junctions with 4 bp or longer MH in Sγ1 (lower panel) in activated B cells with indicated genotypes. Data are represented as mean ± SD in (b, c, d). Two-tail unpaired t-test was performed for (b) and (d). Data from Ercc6l2 knockout are compared with those from other genotypes. ****p < 0.0001, ***p < 0.001, **p < 0.01; *p < 0.05, ns: p > 0.05.

