
Fig. 4. Analysis of the enzyme activity of TrpEG in the synthesis of anthranilic acid.
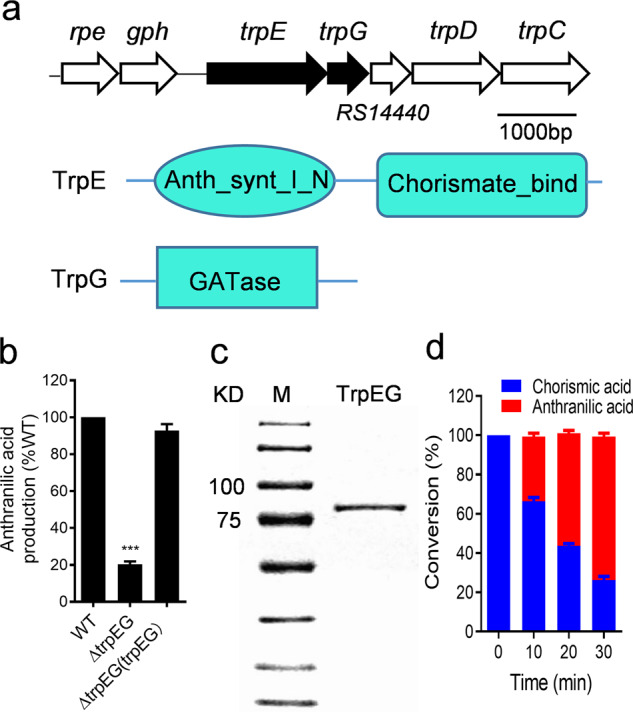
a Genomic organization of the trpEG region in R. solanacearum GMI1000 (top). Domain structure analysis of TrpE (middle) and TrpG (bottom). b Detection of anthranilic acid production via the LC-MS assay. c SDS-PAGE analysis of the TrpEG protein. d Analysis of the production of anthranilic acid by TrpEG to catalyse chorismic acid transformation. The data are means ± standard deviations of three independent experiments. ***p < 0.001 (unpaired t test).