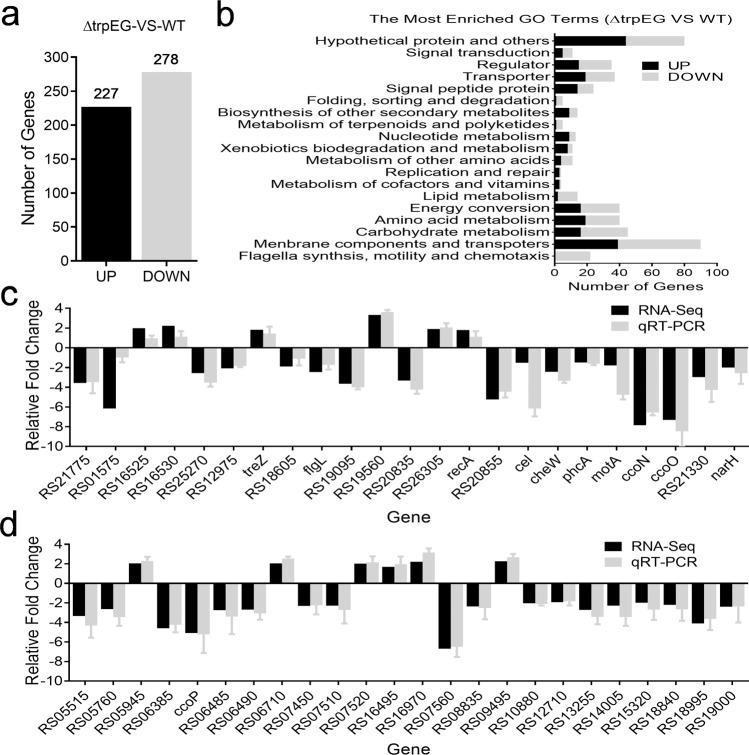
Fig. 8. Differential gene expression profiles between the R. solanacearum GMI1000 trpEG mutant strain and the wild-type strain as measured by RNA-Seq (Log2 fold-change ≥1.5).
a A number of genes were upregulated and downregulated in ∆trpEG compared with the wild-type strain. b GO term enrichment analysis of differentially expressed genes between the ∆trpEG and wild-type strains. Divergently regulated genes are not depicted in these diagrams but can be found in Supplementary Table 4. c, d qRT-PCR analysis of the genes that showed differential expression in the trpEG mutant strain compared with the wild-type strain.

