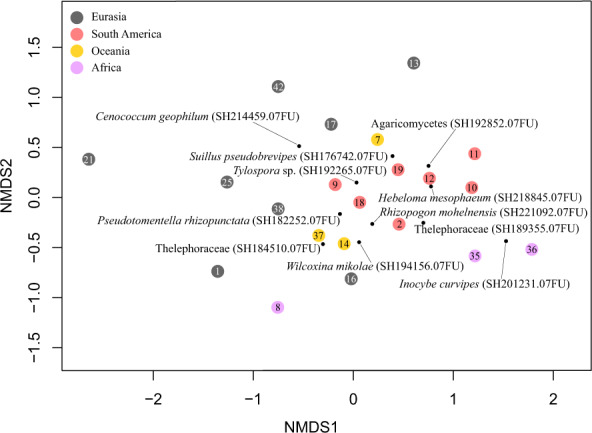
Fig. 2. Nonmetric multidimensional scaling (NMDS) plot of community composition of EcMF associated with alien Pinaceae.

Symbols with numbers correspond to the individual datasets. Colors of the symbols indicate different geographical regions of origin. Black dots indicate positions of the most common EcMF in the ordination space. Stress value = 0.21. Numbers in the sample points correspond to the ID of individual EcMF datasets (Table 1).
