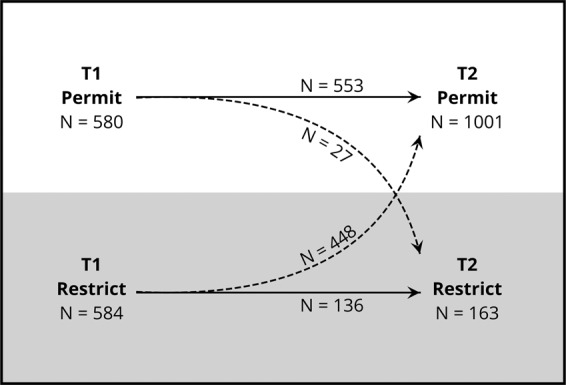
Fig. 3. Stability of participants’ next-of-kin access preference.

Stability of participants’ next-of-kin access preference between T1 (time of biobank consent) and T2 (time of survey completion), n = 1164. Solid arrows indicate participants whose access preferences were the same at T1 and T2. Dotted lines indicate participants whose access preference changed between T1 and T2.
