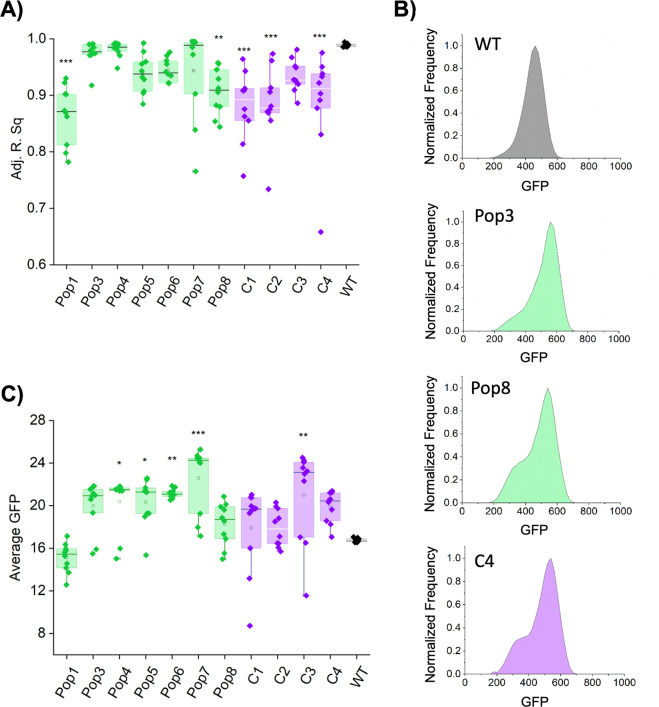
Fig. 2. Evolutionary changes in phenotypic heterogeneity pattern and expression of eps.
a Changes in distribution of Peps-GFP signal in co-evolved (Pop1–Pop8) and evolved (C1–C4) WT populations compared with the WTanc manifested as a decline of adjusted R-square values for Gauss model fitting. b Flow cytometry analysis showing average distributions of Peps-GFP in WTanc (dark gray), WT evolved with cheaters, Pop3 and Pop8 (green) and WT evolved without cheaters, C4 (purple). c Average Peps-GFP expression levels in co-evolved (Pop1–Pop8) and evolved (C1–C4) WT populations compared with the WTanc, calculated from mean values of Peps-GFP expression within ten single isolates. For a and c panels *p < 0.05; **p < 0.01; ***p < 0.001 compared with the WTanc (one-way repeated measures ANOVA, Dunnett test). All data and corresponding p values are provided in Supplementary Data 1. (Color figure online).

