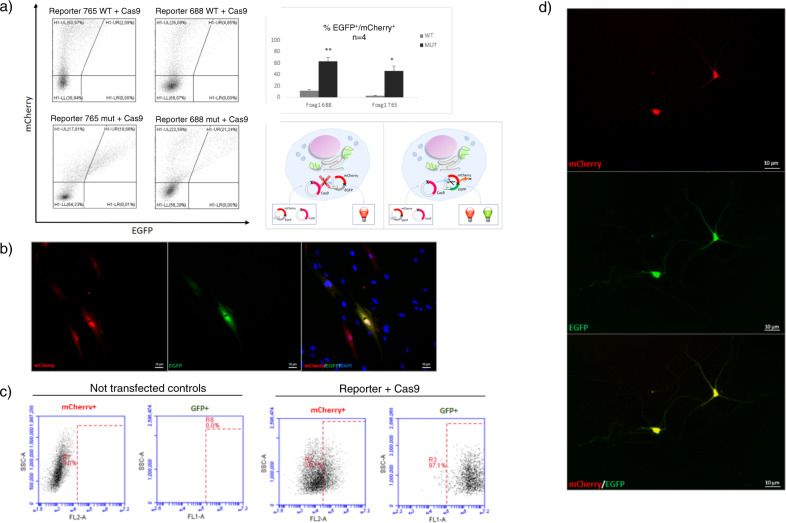
Fig. 2. Transfection experiments.
a Plasmids functionality demonstration and sgRNA specificity. Representative results of FACS analysis on HEK293 cells 48 h after transfection with Cas9 plasmid and mCherry/EGFP targeting plasmid in which the target sequence between mCherry and EGFP harbors either the variant-specific (lower panel) or the wild-type sequence (upper panel), for c.765G>A and c.688C>T pathogenic variants, respectively, are shown. The population of mCherry+/EGFP+ cells is gated in the UR quadrant. Significant double mCherry/EGFP fluorescence is present only in the cells co-transfected with the variant-specific targeting plasmid and the Cas9 plasmid (18.66 and 21.24% for c.765G>A and c.688C>T, respectively for the presented experiment) demonstrating the specificity of the sgRNA. The presence of an mCherry+/EGFP+ population on the plots of cells transfected with the targeting plasmid harboring the wild-type target sequence between mCherry and EGFP is due to a residual aspecific activity of Cas9. The percentage of double positive population showed on histogram, confirms the sgRNA specificity for the variant-specific sequence. Statistical significance was determined using unpaired student’s t test (*p < 0.05, **p < 0.005). A cartoon illustrating the approach is presented on the right. b–c Plasmids activation in fibroblasts. Fibroblasts harboring the c.688C>T variant analyzed by in vivo fluorescence microscopy 48 h after co-transfection show the presence of double mCherry+/EGFP+ cells (b), also confirmed by FACS quantitation (c). A percentage of 50.7% of cells transfected with targeting and Cas9 plasmids in combination is mCherry+; 97.1% of mCherry+ cells are also EGFP+. Globally, 48.75% of cells are double mCherry+/EGFP+. Untransfected fibroblasts, used as negative control, are shown on the left. The y axis shows SSC (side scatter), and the x axis shows fluorescence intensity (FL2-A = mCherry; FL1-A = GFP). The dashed rectangle represents the gating for positive cells. The percentage of positive cells is indicated inside the graphs. d In vivo fluorescence imaging of iPSC-derived neurons. In vivo fluorescence microscopy images of iPSC-derived neurons harboring the c.688C>T variant 6 days after transfection showing double mCherry (upper panel) and EGFP (lower panel) expression. Images are ×20 (b) and ×40 (d) magnification.

