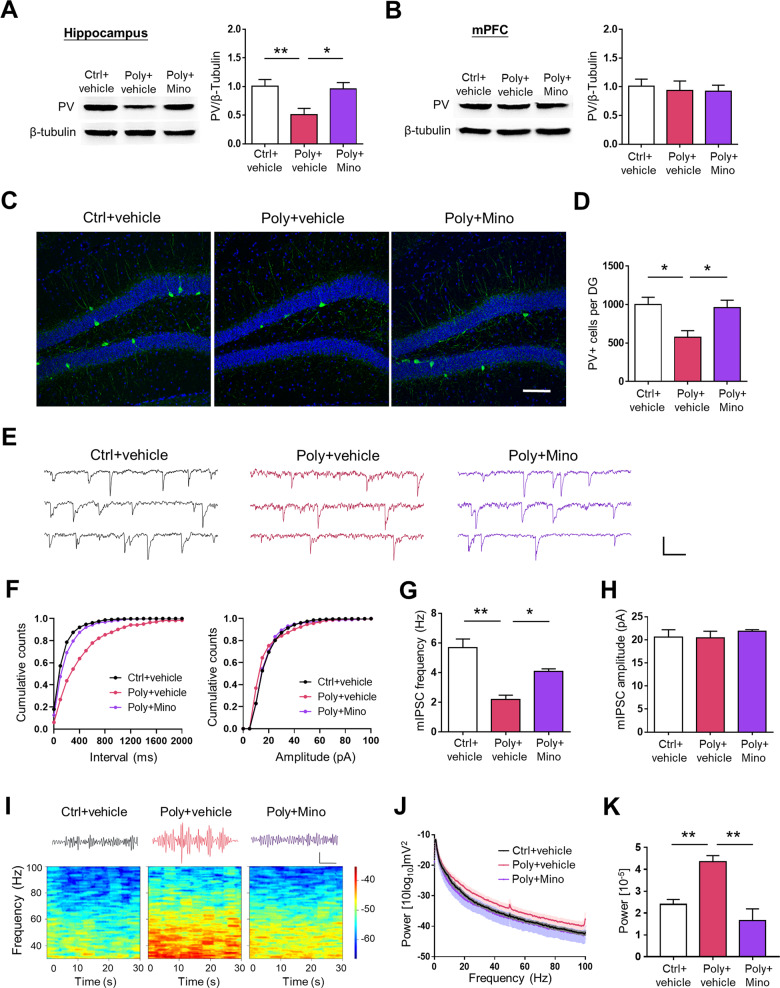
Fig. 2. Minocycline treatment attenuates MIA-induced deficits in PV expression and GABAergic transmission onto GCs of the offspring.
a Western blot analysis revealed a decreased PV expression levels in the hippocampus of Poly+vehicle offspring relative to the Ctrl+vehicle offspring, and upregulated in Poly+Mino offspring. n = 6 mice per group; F2, 15 = 5.759, P < 0.05, one-way ANOVA. b There is no significant difference of PV expression in the mPFC between the three groups. n = 6 mice per group; F2, 15 = 0.166, P > 0.05, one-way ANOVA. c Representative micrographs of PV+ interneurons (green) in the DG. Scale bars: 100 μm. d The total number of PV+ cells were reduced in Poly+vehicle offspring, and the defect was improved in Poly+Mino offspring. n = 6 mice per group; F2, 15 = 4.064, P < 0.05, one-way ANOVA. e Representative mIPSC traces in hippocampal slices from Ctrl+vehicle, Poly+vehicle, and Poly+Mino offspring. Scale bars, 200 ms and 20 pA. f Cumulative plots of mIPSC frequencies. g Attenuated mIPSC frequency of granule cells in Poly+vehicle offspring compared to Ctrl+vehicle offspring, whereas ameliorative in Poly+Mino offspring. n = 15 cells from 5 mice per group; F2, 42 = 8.637, P < 0.05, one-way ANOVA. h mIPSC amplitudes were similar within Ctrl+vehicle, Poly+vehicle and Poly+Mino offspring. n = 15 cells from 5 mice per group; F2, 42 = 0.948, P > 0.05, one-way ANOVA. i Minoycline rescued the hypersynchronic activity in Poly+vehicle offspring. Top, example gamma-band traces from hippocampus. Scale bar, 200 ms and 0.5 mV. Bottom, spectrograms from hippocampus. j Power spectrum of DG LFP from 0.5-100 Hz (shaded areas, SEM). k Average relative LFP power in gamma frequency bands (30–80 Hz) of different groups. n = 6 mice per group; F2, 15 = 20.58, P < 0.01, one-way ANOVA. *p < 0.05, **p < 0.01. Values are the mean ± SEM.

