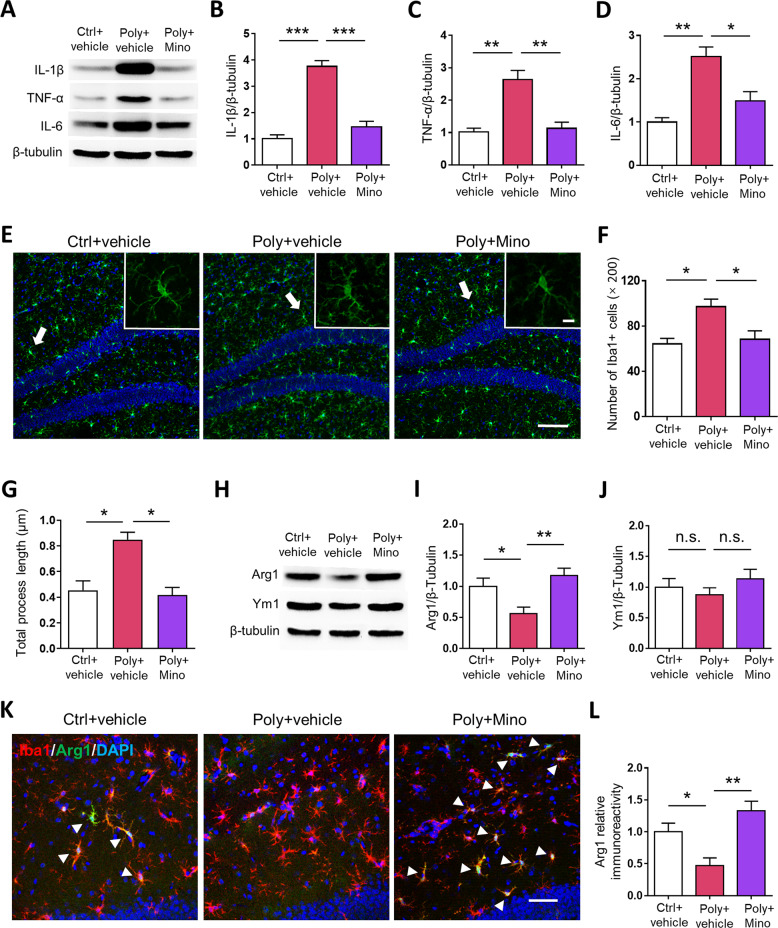
Fig. 3. Minocycline treatment reduces neuroinflammation and upregulates the hippocampus Arg1 expression in activated microglia of offspring mice exposed to MIA.
a Representative western blot films for IL-1β, TNF-α, and IL-6 protein expression in the hippocampus of the offspring. The corresponding quantification of b IL-1β, c TNF-α, and d IL-6 in the offspring mice. n = 6 per group; IL-1β: F2, 15 = 18.93, P < 0.001; TNF-α: F2, 15 = 15.24, P < 0.01; IL-6: F2, 15 = 2.95, P < 0.05, one-way ANOVA. e Representative micrographs of Iba1+ cells (green) in the DG. Scale bars: 100 μm. White arrows indicate the cell represented in the inset. Scale bars: 10 μm. f Number of Iba-1+ cells (×20) in the DG of the offspring. n = 6 mice per group; F2, 15 = 9.34, P < 0.05, one-way ANOVA. g Quantitative analysis for mean ramification index of microglia. n = 6 mice per group; F2, 15 = 6.546, P < 0.05, one-way ANOVA. h Representative western blot films for Arg1 and Ym1 protein expression in the hippocampus of the offspring. The corresponding quantification of i Arg1 and j Ym1 expression levels in the offspring. n = 6 mice per group; Arg1: F2, 15 = 5.475, P < 0.05; Ym1: F2, 15 = 1.058, P > 0.05, one-way ANOVA. k Representative fluorescent images for Arg1 immunoreactivity in the DG of offspring mice. Scale bars: 20 μm. l Quantification of Arg1 immunoreactivity (in arbitrary units) in the DG. n = 6 mice per group; F2, 15 = 4.197, P < 0.05, one-way ANOVA. *p < 0.05, **p < 0.01, ***p < 0.001, n.s., not significant. Values are the mean ± SEM.

