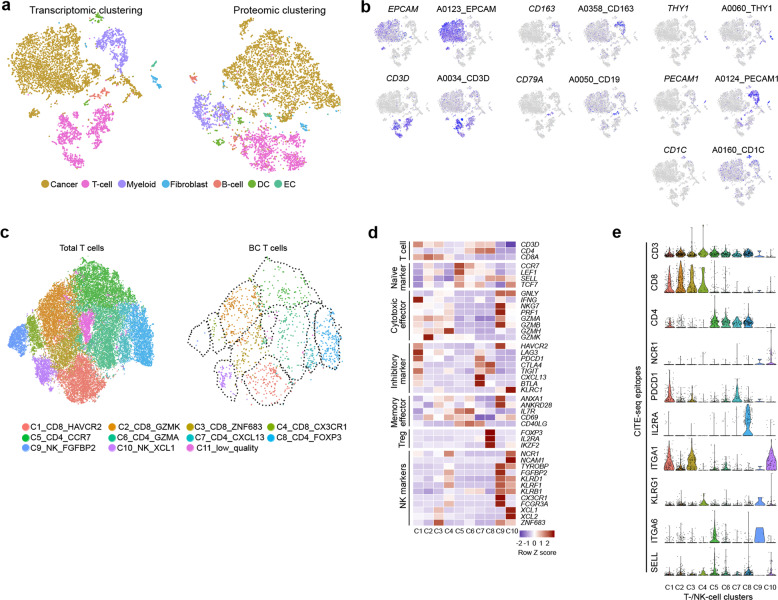
Fig. 9. Validation of the stromal blueprint by CITE-seq.
a t-SNEs of CITE-seq profiled BC cells clustered into cell types based on RNA (left) or protein (right) data. b Marker gene or protein expression for each cell type. c t-SNE plots showing BC T-/NK-cells co-clustered with 3′-scRNA-seq data from other cancer types (left), while highlighting only T-/NK-cells with BC origin (right). d Heatmap with marker gene expression of T-/NK-cell clusters. e Expression by CITE-seq markers per T-/NK-cell cluster.

