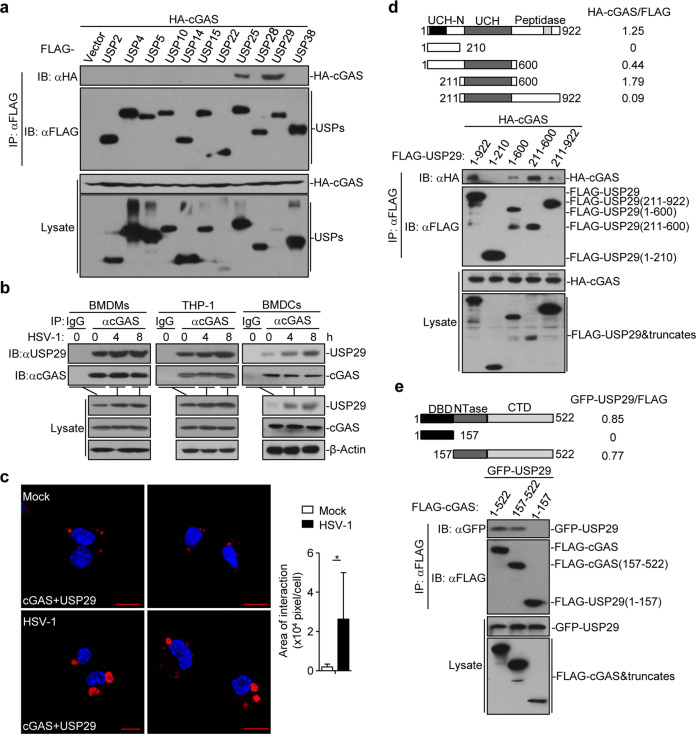
Fig. 1. USP29 interacts with cGAS.
a Immunoprecipitation (IP, with anti-FLAG) and immunoblot analysis (with anti-FLAG and anti-HA) of HEK293 cells transfected with plasmids encoding FLAG-tagged USPs and HA-cGAS for 24 h. b Immunoprecipitation (with anti-cGAS or control IgG) and immunoblot analysis (with anti-cGAS or anti-USP29) of BMDMs (left), THP-1(middle) and BMDCs (right) left uninfected or infected with HSV-1 for 4-8 h. c Proximity ligation assay (PLA) and confocal microscopy imaging of cGAS and USP29 interaction in MEFs that were left uninfected (Mock) or infected with HSV-1 for 4 h (left images). The association intensities of the red spots were quantified with Image-Pro Plus software and calculated as pixels per cell (right graph) (n = 8). d, e Immunoprecipitation (with anti-FLAG) and immunoblot analysis (with anti-FLAG or anti-HA) of HEK293 cells transfected with plasmids encoding HA-cGAS and FLAG-tagged USP29 or USP29 truncates for 24 h (d) or transfected with plasmids encoding GFP-USP29 and FLAG-cGAS or cGAS truncates for 24 h (e). *P < 0.05 (two-tailed Student’s t-test). Scale bars represent 10 μm. Data are representative of three independent experiments (means ± SD in c).

